AUD/USD had a quiet week, which was marked by thin trade over the holidays. The pair posted modest losses, closing at 0.8868. There are just four releases this week. Here is an outlook on the major market-movers and an updated technical analysis for AUD/USD.
The US bounced back with strong data last week, as Unemployment Claims and New Home Sales looked sharp. Despite the strong numbers, the US dollar could only muster slight gains.
[do action=”autoupdate” tag=”AUDUSDUpdate”/]AUD/USD graph with support and resistance lines on it. Click to enlarge: 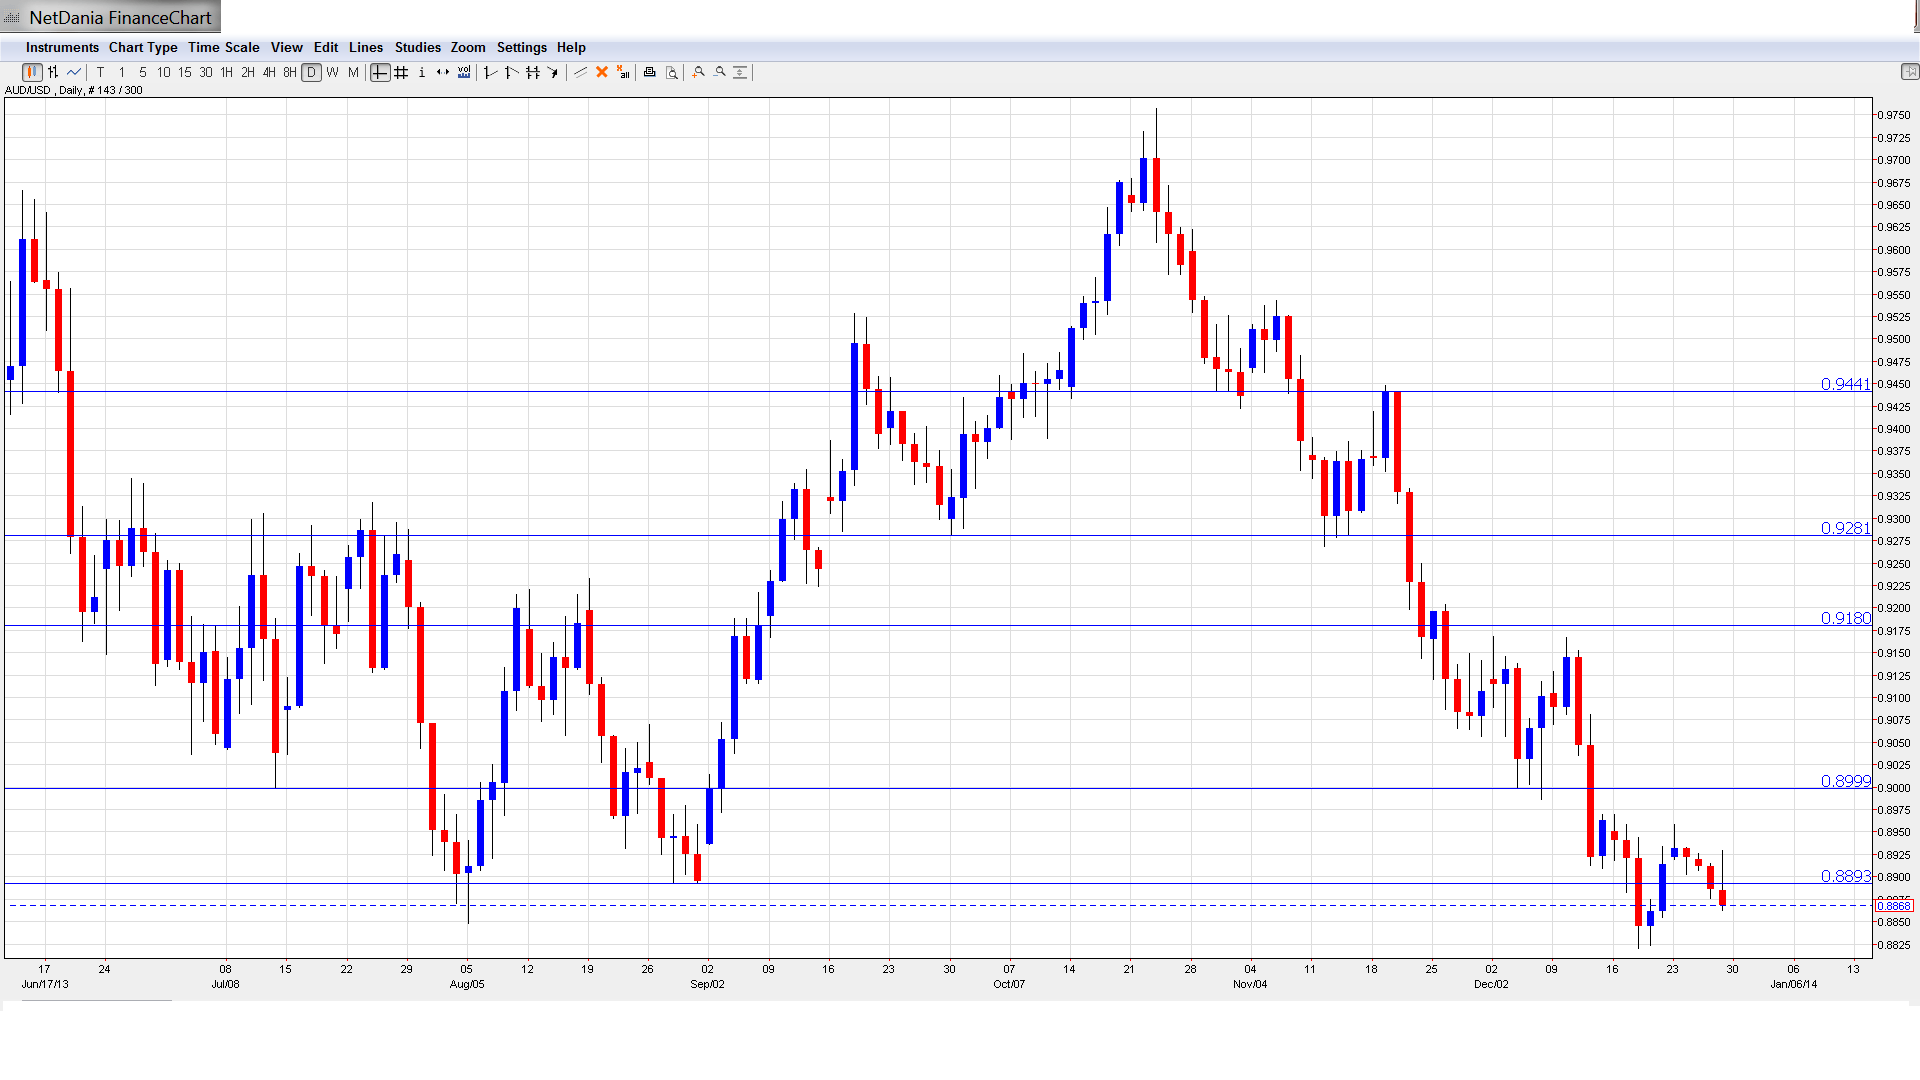
- Private Sector Credit: Tuesday, 00:30. Private Sector Credit looks at the amount of new credit issued to consumers and businesses. An increase in borrowing likely signals more spending, which is critical for economic growth. The indicator has shown little movement recently, posting gains of 0.3% for the past three releases. The estimate for November stands at 0.4%.
- Chinese Manufacturing PMI: Wednesday, 1:00. This key index has been very steady, posting four consecutive readings around the 51 line, which indicates slight expansion in the manufacturing sector. Little change is expected in the November release.
- AIG Manufacturing Index: Wednesday, 22:30. The index continues to fluctuate above and below the key 50 line, as the manufacturing sector has had difficulty creating positive momentum. The indicator dropped to 47.7 in October and the markets will be looking for an improvement in the upcoming release.
- Commodity Prices: Thursday, 5:30. Commodity Prices is an important indicator since Australia relies heavily on its export sector. The indicator continues to post declines, but recent releases have improved dramatically from the sharp declines which characterized the indicator. The November reading posted a decline of 1.9% and the markets will be hoping for a stronger reading from this week’s release.
*All times are GMT
AUD/USD Technical Analysis
AUD/USD started the week at 0.8922 and quickly hit the week’s high of 0.8958. The pair then dropped to a low of 0.8862, breaking through support at 0.8893 (discussed last week) and closed at 0.8868
Live chart of AUD/USD: [do action=”tradingviews” pair=”AUDUSD” interval=”60″/]
Technical lines from top to bottom:
We start with resistance at 0.9441. This line marks the start of a downward spiral in November which saw the Australian dollar drop close to the key 0.90 level.
0.9283 saw a lot of action in the months of June and July, alternating between resistance and support roles. It has provided steady resistance since November.
0.9180 is the next line of resistance. It is followed by the round number of 0.9000, which held firm as AUD/USD moved higher early in the week.
0.8893 was breached for the second straight week and has reverted to a resistance role. It is a weak line and could be tested if the Aussie reverses directions and gains ground.
0.8728 was last breached in July 2010, when the Australian dollar began an extended rally that saw it climb close to the 1.10 line. This is followed by 0.8578.
0.8432 is the final support line for now. This line played a key support role in late 2009.
I am bearish on AUD/USD.
The Australian dollar continues to flounder and is trading below the 0.89 level. With QE taper a reality, we can expect further taper moves by the Fed, which will likely give a boost to the US dollar.
- For a broad view of all the week’s major events worldwide, read the USD outlook.
- For EUR/USD, check out the Euro to Dollar forecast.
- For the Japanese yen, read the USD/JPY forecast.
- For GBP/USD (cable), look into the British Pound forecast.
- For the Australian dollar (Aussie), check out the AUD to USD forecast.
- USD/CAD (loonie), check out the Canadian dollar.
