AUD/USD dipped below the 0.90 level and lost close to a cent on the week. The pair closed at 0.8971. This week’s highlight is Private Capital Expenditure. Here is an outlook on the major market-movers and an updated technical analysis for AUD/USD.
Both US and Australian releases ran into turbulence last week. In Australia, New Motor Vehicle Sales posted a sharp decline and skidded to a six-month low. US releases continues to sputter, as the Philly Fed Manufacturing Index and Existing Home Sales slipped badly in January.
[do action=”autoupdate” tag=”AUDUSDUpdate”/]AUD/USD graph with support and resistance lines on it. Click to enlarge: 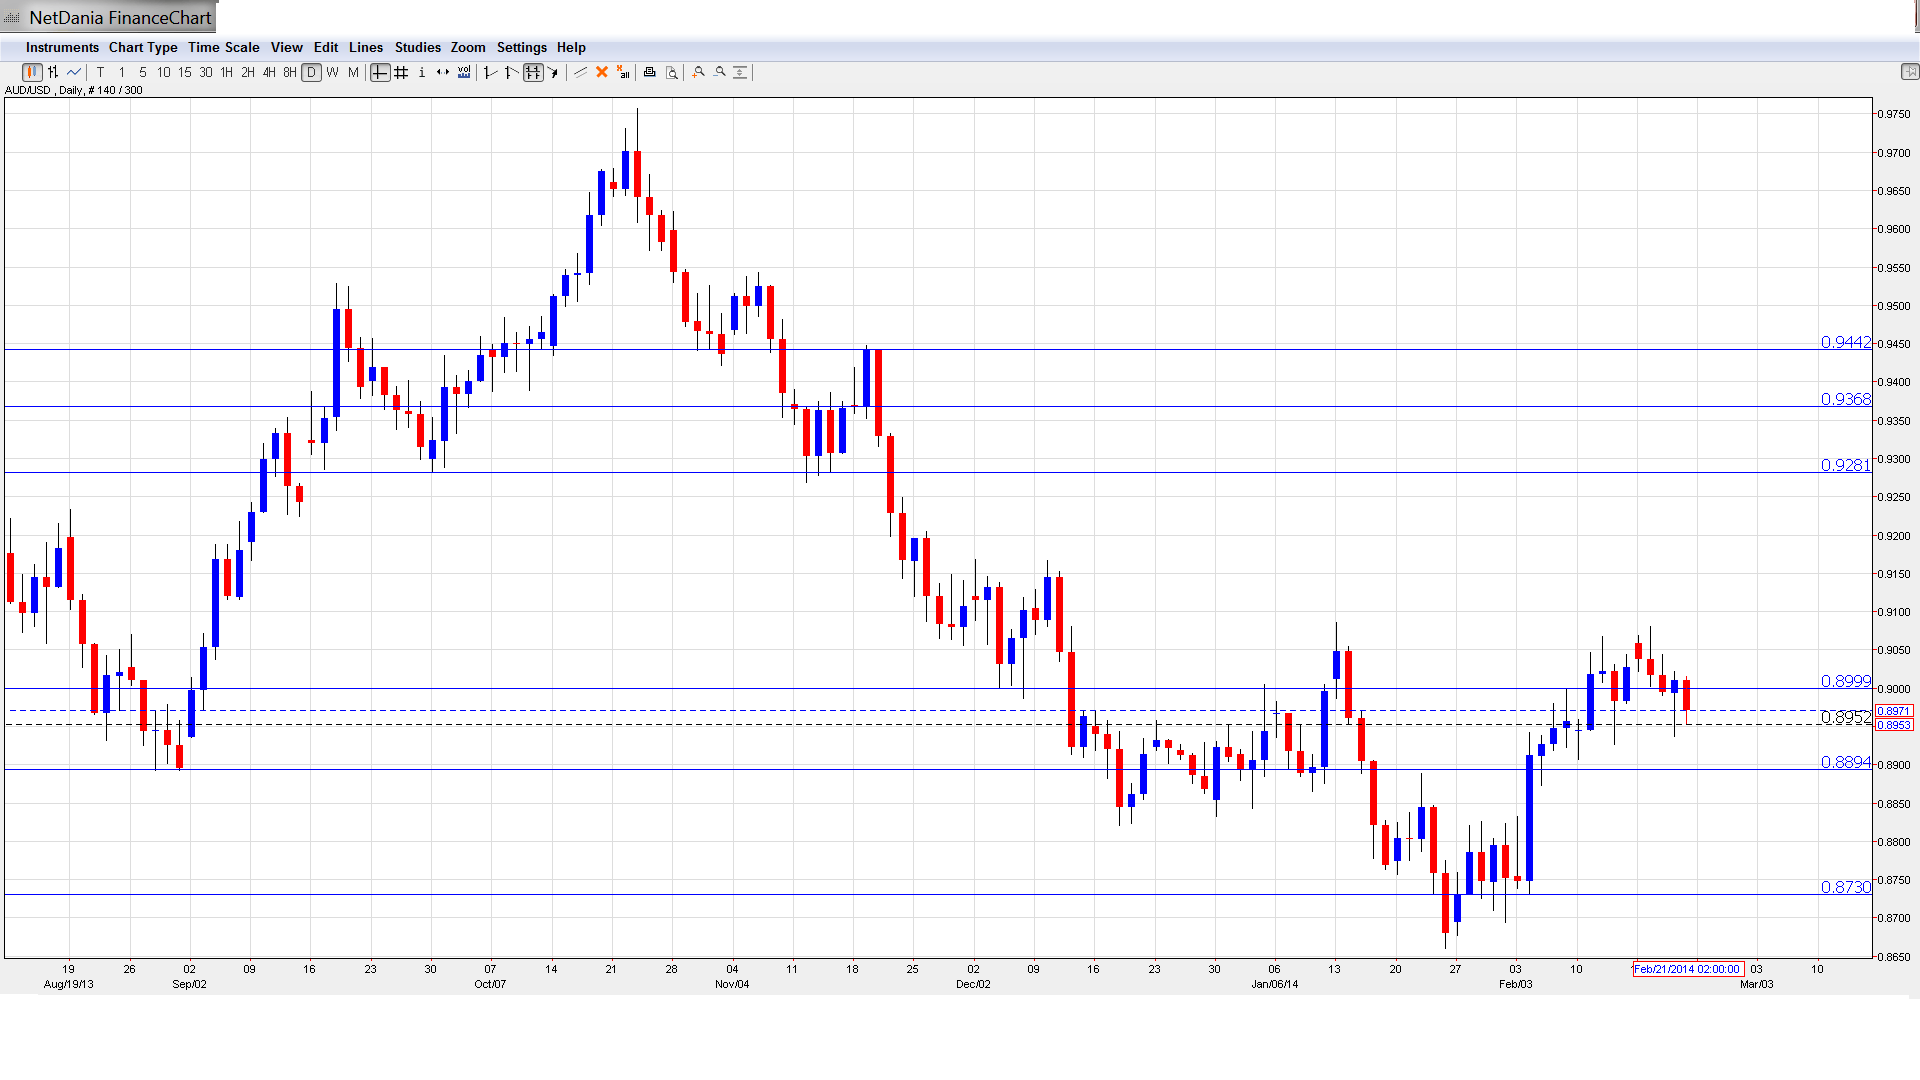
- Construction Work Done: Wednesday, 00:30. This indicator is released on a quarterly basis, magnifying the impact of each release. The Q3 reading looked very sharp with a gain of 2.7%, crushing the estimate of 0.6%. The markets are expecting a much more modest gain in Q4, with the estimate standing at just 0.4%. Will the indicator repeat and outdo the prediction?
- Private Capital Expenditure: Thursday, 00:30. This is the highlight of the week. This indicator gauges new investment in the private sector, and an unexpected reading can affect the movement of AUD/USD. The past two quarters have seen strong gains which easily surpassed the estimates. However, the markets are bracing for a weak Q4, with an estimate of -1.0%.
- Private Sector Credit: Friday, 00:30. The indicator measures the change in new credit offered to the private sector. Credit levels are closely connected to spending, as an increase in borrowing by consumers and businesses translates into more spending.
- Chinese Manufacturing PMI: Saturday, 1:00. Key Chinese data such as PMIs can affect AUD/USD, since China is Australia’s number one trading partner. Manufacturing PMI has been above the 50-point line in recent readings, but not by much. The 50 level separates contraction from expansion. The December reading came in at 50.5 points, very close to the estimate of 50.6 points. The markets are not expecting much change in the upcoming reading, with an estimate of 50.2 points.
*All times are GMT.
AUD/USD Technical Analysis
AUD/USD started the week at 0.9058 and touched a high of 0.9081. The pair then reversed directions, dropping below the 0.90 line (discussed last week) and touching a low of 0.8937. The pair closed the week at 0.8971.
Technical lines from top to bottom:
We begin with resistance at 0.9442. This marked the high point of the pair in November, which saw the Aussie go on a sharp slide and drop below the 0.89 line. This is followed by resistance at 0.9368, which was an important line in mid-November.
Next, there is resistance at 0.9283. This line saw a lot of action in the months of June and July, alternating between resistance and support roles. It has provided steady resistance since November.
0.9180 follows. It is followed by the round number of 0.9000, which was breached again this week as the Aussie lost ground. This key line has switched to a support role and is a weak line.
0.8893 is the next support line. 0.8728 marks the low point of an Aussie rally which began in early February and pushed above the 0.90 level.
This is followed by 0.8578, which has remained intact since July 2010.
The final support level for now is 0.8432, which played a key support role in late 2009.
I am bearish on AUD/USD.
The Aussie has dipped back below the 0.90 level, and with the Australian economy not churning out impressive numbers, there is room for the currency to fall further. The US is also having its problems but market sentiment remains upbeat and QE tapering is expected to continue, which would be a vote of confidence from the Federal Reserve.
- For a broad view of all the week’s major events worldwide, read the USD outlook.
- For EUR/USD, check out the Euro to Dollar forecast.
- For the Japanese yen, read the USD/JPY forecast.
- For GBP/USD (cable), look into the British Pound forecast.
- For the Australian dollar (Aussie), check out the AUD to USD forecast.
- USD/CAD (loonie), check out the Canadian dollar.
