The Australian dollar continues to lose ground against the US currency, and dropped over one cent last week. AUD/USD closed the week at 0.9644. This week’s highlights include Building Permits and Private Capital Expenditure. Here is an outlook of the events and an updated technical analysis for AUD/USD.
The Aussie is still feeling the effect a the RBA’s rate cut and a gloomy budget forecast from the government. Australian releases have not been impressive, and the Australian dollar has been no match for the US dollar, which has enjoyed broad strength lately.
Updates:
The Aussie started the week with downside pressure after a lot of bad press over the weekend. Despite trading around 0.9630, an Elliott Wave analysis shows that it could reach 0.9850 before the downtrend resumes .
There are no Australian indicators until Wednesday, when HIA New Home Sales and Construction Work Done will be released. AUD/USD is finally showing some upward movement, and was trading at 0.9676.
AUD/USD is retreating towards support following a better than expected consumer confidence number in the US. The 5 year high in confidence seemed to have ended the Aussie’s correction.
More: Aussie remains pressured by negative press – critical support could not hold for too long
AUD/USD Breaks to lowest since October 2011 Dollar falls on violent correction, and AUD/USD escapes the abyss AUD/USD rises on positive data to tackle 0.97 : better than expected building approvals and future capex (2013/14) push the Aussie higher. 0.97 is now a double top, and the earlier drop looks like a hammer pattern.MI Leading Index posted a modest 0.2% gain. HIA New Homes Sales recorded another strong gain, rising 3.9%. Construction Work Done declined 2.0%, way off the estimate of a 1.1% gain. Building Approvals shot up 9.1%, its best showing since July 2012. The estimate stood at 4.1%. However, Private Capital Expenditure could not keep pace, falling by 4.7%. The markets had expected a gain of 0.7%. Private Sector Credit will be released on Friday, and Chinese Manufacturing PMI, a key event, will wrap up the week on Saturday. The Aussie continues to rally, as the pair was trading at 0.9673.
Roller coaster : A worried market mood sent the Aussie down to test support towards 0.9580. But then, US GDP and jobless claims disappointed, and helped the Aussie recover. Another disappointment from pending home sales already sent the pair back to high ground at 0.9670 at the time of writing.Breakdown: The end of month madness sends AUD/USD below critical support . The end of month fixing (a stronger Aussie after the big falls), could already be over, with the pair resuming the downtrend. Next support is 0.9527.
AUD/USD ends the week on the lows, at 0.9570, below the 0.9580 line, due to post end of month flows . All in all, May has been a terrible month for the Aussie. An updated Aussie forecast will be released on Sunday.
AUD/USD graph with support and resistance lines on it. Click to enlarge:
<img alt=”AUD USD Forecast May 13-17″ src=”https://www.forexcrunch.com/wp-content/uploads/2013/05/AUD-USD-Forecast-May-13-17-350×196.png” width=”350″ height=”196″ /> <img alt=”AUD USD Forecast May 6-10″ src=”https://www.forexcrunch.com/wp-content/uploads/2013/05/AUD-USD-Forecast-May-6-10-350×196.png” width=”350″ height=”196″ /> <img alt=”AUD USD Forecast Apr 29-May3″ src=”https://www.forexcrunch.com/wp-content/uploads/2013/04/AUD-USD-Forecast-Apr-29-May3-350×196.png” width=”350″ height=”196″ /> <img alt=”AUD USD Forecast Apr 22-26″ src=”https://www.forexcrunch.com/wp-content/uploads/2013/04/AUD-USD-Forecast-Apr-22-26-350×196.png” width=”350″ height=”196″ /> <img alt=”AUD USD Forecast Apr 15-19″ src=”https://www.forexcrunch.com/wp-content/uploads/2013/04/AUD-USD-Forecast-Apr-15-19-350×196.png” width=”350″ height=”196″ /> <img alt=”AUD USD Forecast Apr 8-12″ src=”https://www.forexcrunch.com/wp-content/uploads/2013/04/AUD-USD-Forecast-Apr-8-12-350×196.png” width=”350″ height=”196″ /> <img alt=”AUD USD Forecast Apr 1-5″ src=”https://www.forexcrunch.com/wp-content/uploads/2013/03/AUD-USD-Forecast-Apr-1-5-350×196.png” width=”350″ height=”196″ /> <img alt=”AUD USD Forecast Mar 25-29″ src=”https://www.forexcrunch.com/wp-content/uploads/2013/03/AUD-USD-Forecast-Mar-25-291-350×196.png” width=”350″ height=”196″ /> <img alt=”AUD USD Forecast Mar 18-22″ src=”https://www.forexcrunch.com/wp-content/uploads/2013/03/AUD-USD-Forecast-Mar-18-22-350×196.png” width=”350″ height=”196″ /> <img alt=”AUD USD Forecast Mar 4-8″ src=”https://www.forexcrunch.com/wp-content/uploads/2013/03/AUD-USD-Forecast-Mar-4-8-350×196.png” width=”350″ height=”196″ /> <img alt=”AUD USD Forecast Feb 25-Mar 1″ src=”https://www.forexcrunch.com/wp-content/uploads/2013/02/AUD-USD-Forecast-Feb-25-Mar-12-350×196.png” width=”350″ height=”196″ />
MI Leading Index: Wednesday, 0:30. This index is based on 9 economic indicators, but is a third-tier indicator since most of the indicators which make up the index have already been released. The index matched its high of 2013 in the previous release, posting a 0.6% gain.HIA New Home Sales: Wednesday, Tentative. This important housing indicator bounced back from a sharp decline in the April reading, and recorded a strong gain of 4.2% in May. The markets will be hoping for a similar reading in the upcoming release.Construction Work Done: Wednesday, 1:30. This construction indicator is released every quarter. The indicator has been marked by volatility, making accurate forecasts a tricky task. The indicator looked weak in Q4 of 2013, posting a 0.1% decline. This was well below the forecast of 1.5%. Will Construction Work Done rebound this time around?Building Approvals: Thursday, 1:30. Building Approvals is a key event, and often impacts on the direction of AUD/USD. The indicator looked awful in May, dropping 5.5%. This was way off the forecast of 1.2%. The markets are hoping for a turnaround in the Q1 release.Private Capital Expenditure: Thursday, 1:30. This indicator measures the change in new capital expenditures made by businesses. It is also released each quarter, amplifying the impact of each release. The indicator looked weak in Q4 of 2012, declining 1.2%. The estimate stood at a 1.1% gain. Will the indicator push back into positive territory for the Q1 release?Private Sector Credit: Friday, 1:30. This indicator provides a good snapshot of the willingness of consumers and businesses to borrow money – more borrowing means an increase in spending, which is vital to economic growth. The indicator has posted modest gains of 0.2% for the past three quarters.Chinese Manufacturing PMI : Saturday, 1:00. This key indicator has been slightly above the 50-point level all of 2013, indicating slight expansion in the manufacturing sector. As China is Australia’s number one trading partner, this PMI should be treated as a market mover.
AUD/USD Technical Analysis
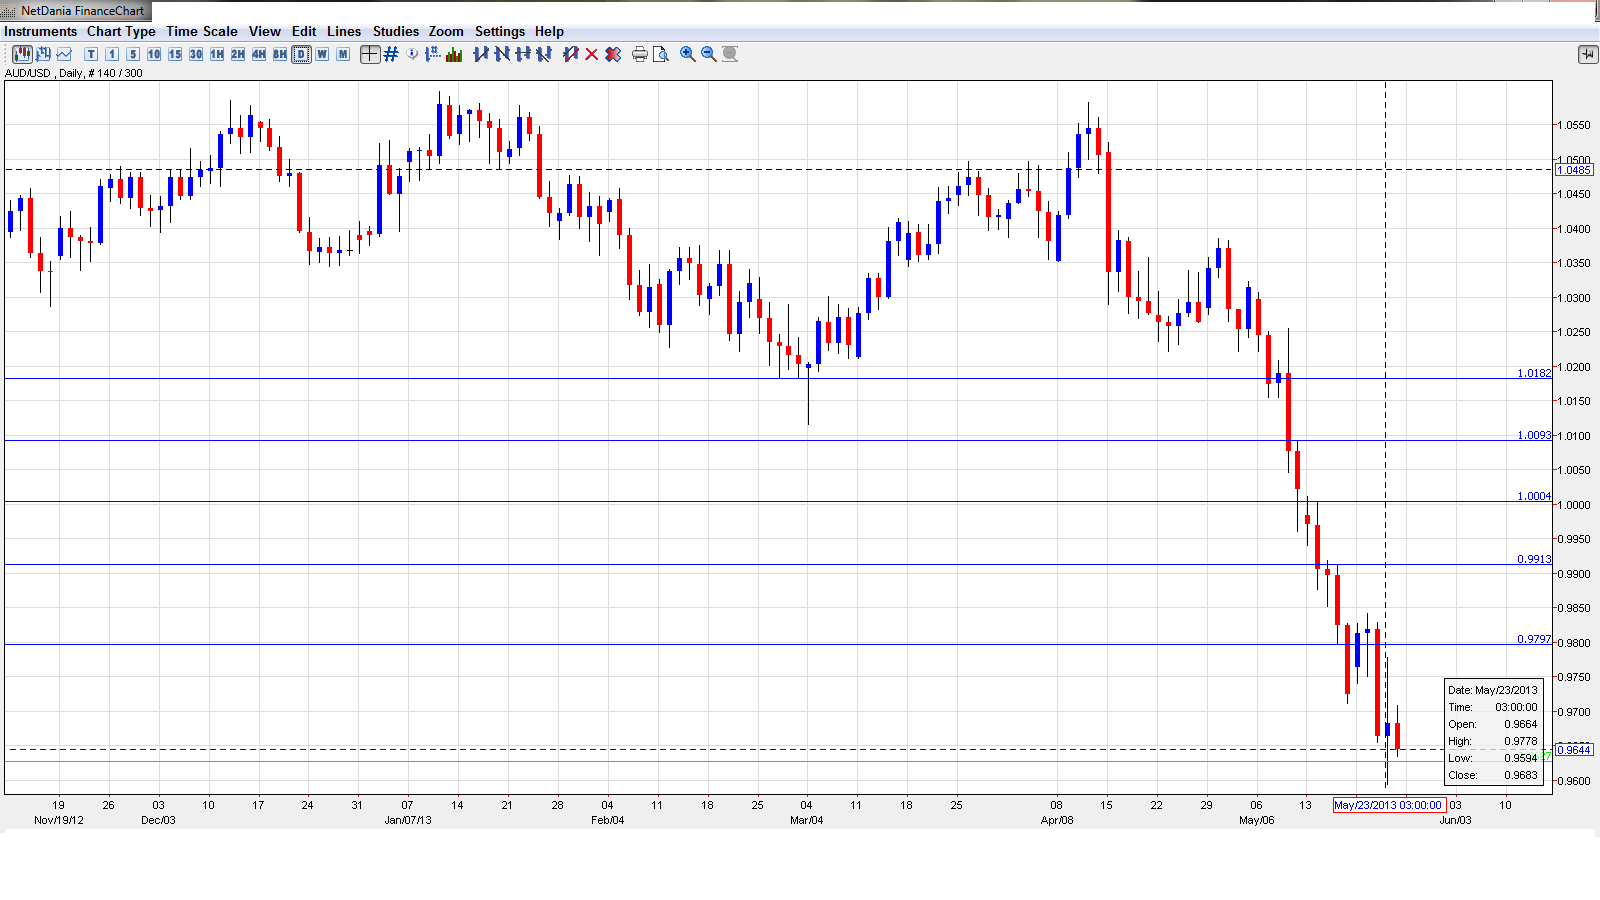
AUD/USD opened at 0.9764, and showed some strength, as the pair touched a high of 0.9842. However, it was all downhill from there, as AUD/USD dipped below the 0.96 level, touching a low of 0.9594. The pair then recovered somewhat, closing at 0.9644, as the support level of 0.9627 (discussed last week ) remained intact.
Technical lines from top to bottom:
We start with strong resistance at 1.0183. This line last saw action in early May. The next line of resistance is at 1.0093. This is followed by the parity line, which AUD/USD crashed through as it continues to push to lower levels. Next is 0.9913. This is followed by 0.9797, which had served as support since June 2012, but was brushed aside as the Aussie slumped. This line has strengthened as the pair trades at lower levels.
AUD/USD is receiving support at 0.9627, which has remained intact since early June 2012. However, it is currently a weak line and could be tested early next week if the surging US dollar continues to post gains. Next, there is support at 0.9541. This line was last tested in September 2011. This is followed by 0.9405, which is protecting the 94 level. This line has remained intact since October 2011. Below is 0.9275, which has not been tested since September 2010. The final support line for now is at 0.9071.
I continue to be bearish on AUD/USD.
The Australian dollar can’t seem to buy a break, and a promising start to the week was quickly snuffed out as the currency dropped another cent against the US dollar. AUD/USD has plunged over six cents in May, and we’ll have to see some sharp numbers out of Australia to stem the pair’s strong downward momentum.
For the bigger picture, the weekly chart provides guidance. Following the crash, here is a guide to the next big levels .
More about the collapse of the Australian dollar:
The Aussie sometimes moves in tandem with gold. You can trade binary options on gold using this technical analysis .
Further reading: