- The BTC/USD moved slightly to the downside but remains entrenched in a range.
- The technical picture is balanced due to the lack of movement.
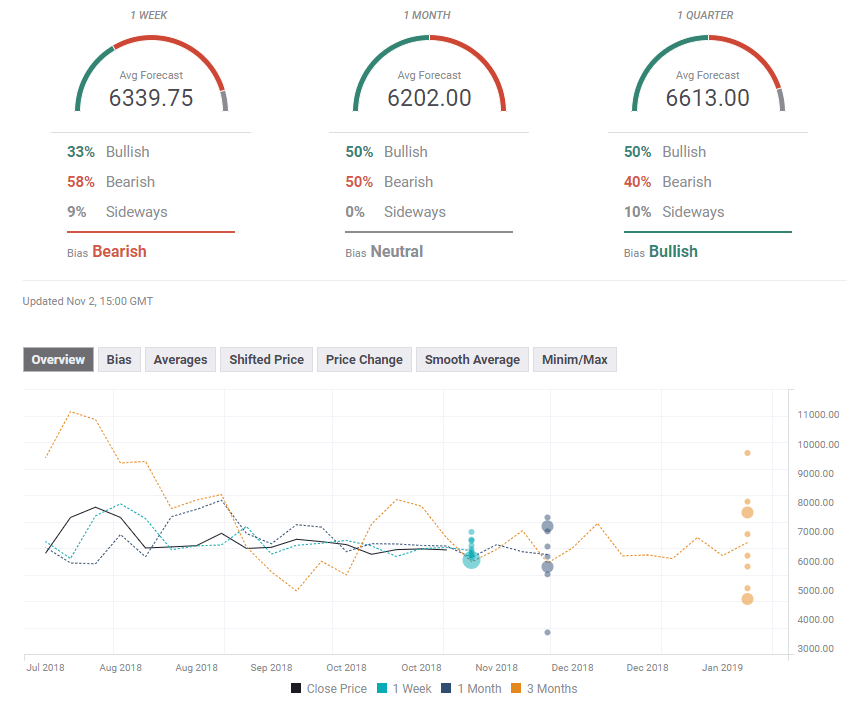
- The FX Poll of experts shows a bearish bias at first but things get better with time.
The price of Bitcoin remains entrenched in a range. Bears made an attempt to push the price lower early in the week, but nothing really materialized. Other major cryptocurrencies are also stuck in narrow ranges without any clear direction.
Expectations for a Bitcoin Exchange Traded Fund remain high, but experts see it coming only in early 2019. A Bitcoin ETF is important in order to enable mainstream investors to jump into cryptocurrency markets. Jamie Dimon, the CEO of JP Morgan, had some profanity to say about Bitcoin in a recent conversation. That did not seem to move the needle.
See: Bitcoin ETF explained: 9 questions and answers about the critical crypto catalyst
Get 24/7 Crypto updates in our social media channels: Give us a follow at @FXSCrypto and our FXStreet Crypto Trading Telegram channel
BTC/USD Technical Analysis – No movement
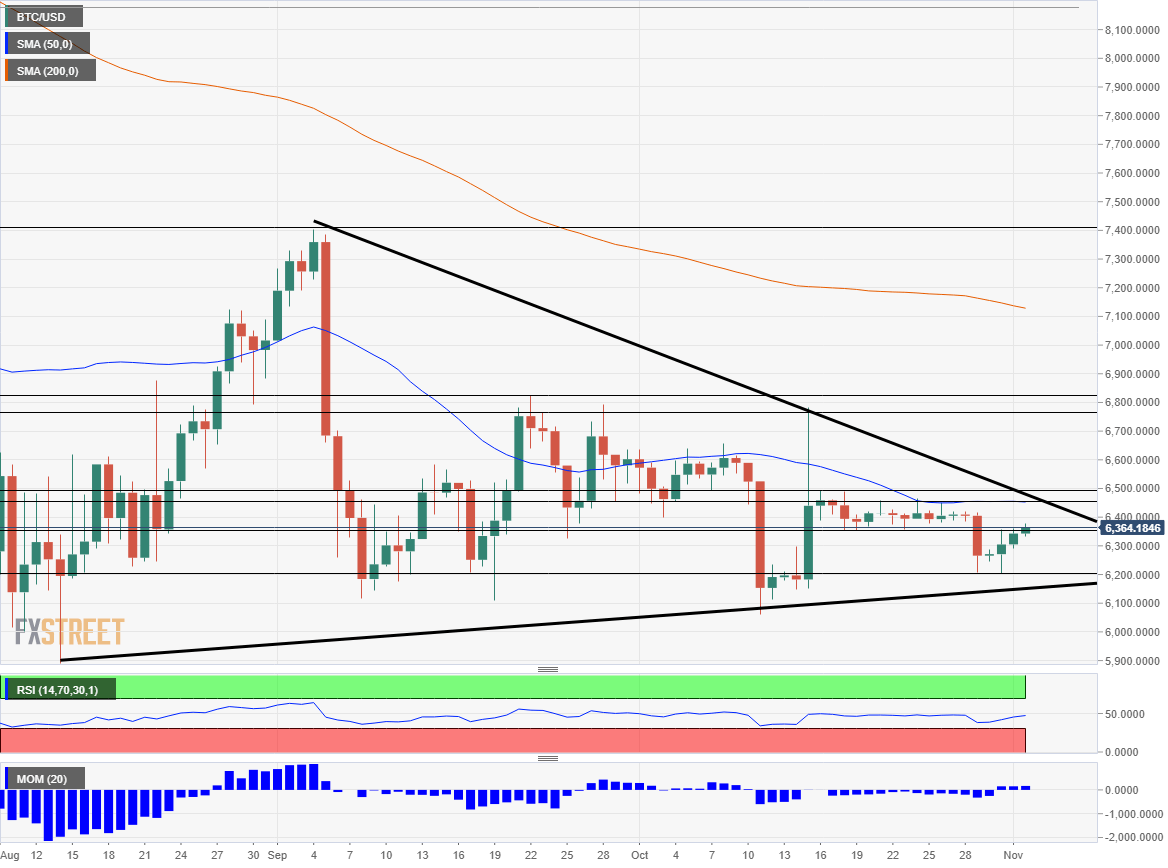
Bitcoin is trading within a narrowing wedge, or triangle. Downtrend resistance is steeper. It dates back from early September when the digital coin hit a high of $7,400. It is set to reach the current price within a week. Uptrend support is not as steep but dates back to mid-August. It is around $6,100 at the time of writing.
The technical textbooks say that when the price is pressured within a wedge, it is set to explode. The direction is unknown. Will we see prices move?
The BTC/USD is not going anywhere. This is not only reflected in the price but also on various indicators. The 50-Day Simple Moving Average has converged with the resistance line of $6,456 and remains flat. The Relative Strength Index moved earlier in the week but stabilized later on. Momentum is nowhere to be seen.
Above $6,456, the next resistance line is $6,491 that capped the pair in mid-October. The next line to note is $6,766 that was a swing high in mid-October as well. Close by, $6,829 was the peak in September.
$6,355 was the bottom of the range last week. Further down, the round level of $6,200 was the low point earlier in the week. $6,080 was a swing low in October and forms part of the uptrend support line.
The Forecast Poll of experts shows a bearish trend in the short term, a neutral one with a lower price prediction later, and a very bullish forecast for the next quarter. The figures have remained mostly unchanged in the past week with only the long-term change being notable.
More: Top 3 Price Forecast Bitcoin, Ethereum, Ripple: Window of bullish opportunity in the next few days
