Uptrend on Aud/Usd shown from 0.8065 May lows is unfinished since the pair formed only a three wave A)-B)-C) decline from the most recent 1.0181 highs. As such, we believe that this retrace was only a temporary pull-back, probably a corrective blue wave (4) which is part of an impulse structure. On our daily chart you will also notice that pair found the base in this past week just above 38.2% retracement area of a wave (3) distance and around the base channel support zone at the same time, which is a strong evidence that wave (4) lows are in place around 0.9530.
With this being said, the outlook for Aud/Usd remains very bullish with wave (5) yet to come, a leg that should reach levels above 1.0181 November highs.

In fact, when the global markets are moving higher traders usually grab the opportunity on high yielding currencies, such as Australian dollar. They buy high yielding currency usually against the U.S. dollar because the greenback has a negative correlation with the global market move, as investors take money from “safe havens” and put it into the risky assets.
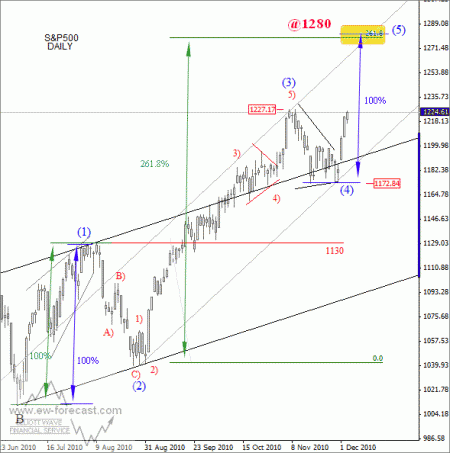
Well, if we take a look on the S&P500 daily chart then we can see that “risk is on” and will likely continue till the end of this year. The price structure shows a contracting triangle in wave (4) followed by a wave (5) which will break above 1227 high soon. Once highs are out, market will have room for gains all the way towards the 1280 area, which also means more upside for Aud/Usd.
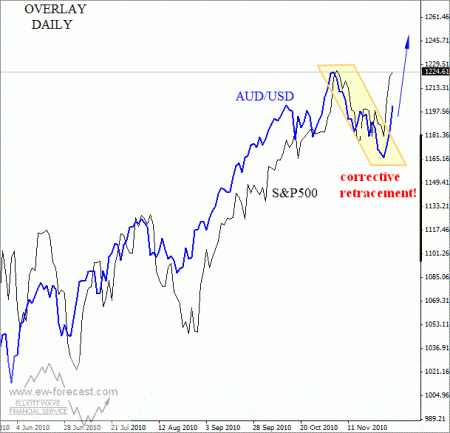
The last chart that we will show you today is an overlay chart between S&P500 and Aud/Usd which confirms a positive and very strong correlation between these two markets and that a recent reversal was just another correction within uptrend.
If you need more Elliott Wave forecast in the forex market, please visit us at www.ew-forecast.com, and check out our services here.
Want to see what other traders are doing in real accounts? Check out Currensee. It’s free..


