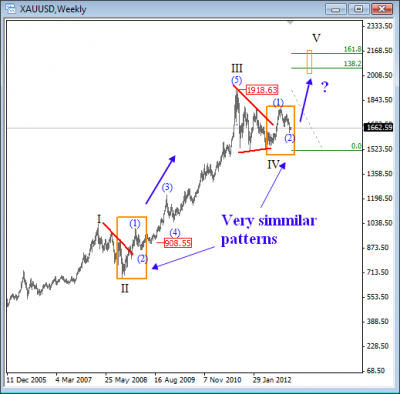
Gold prices remain in an uptrend after breaking through the resistance line (in red) connected from the all-time highs. This break looks very similar to the one that occurred in 2009 when gold was trading around $900 per ounce.
In fact, from an Elliott Wave perspective, recent sideways price action from August 2011 high was slow, choppy and overlapping, so we believe it represents wave IV that puts wave V in play for 2013.

For more details on gold technical outlook please review our video below, recorded on Dec 21st
VIDEO: AUDUSD, USDCAD and GOLD
It seems that 2013 will be very exciting year with a lot of opportunities lying ahead. If you want to join this adventure then now it’s right opportunity for you to test our services now.
