The pound’s woes continue, as GBP/USD lost about 160 points last week. The pair closed the week at 1.6818. This week’s highlight are PMI releases and Manufacturing Production. Here is an outlook for the main events moving the pound, and an updated technical analysis for GBP/USD.
In the UK, Manufacturing PMI softened in July, dropping to a three-month low. Over in the US, consumer confidence and manufacturing data were strong, but Nonfarm Payrolls took a tumble in June and was well off expectations.
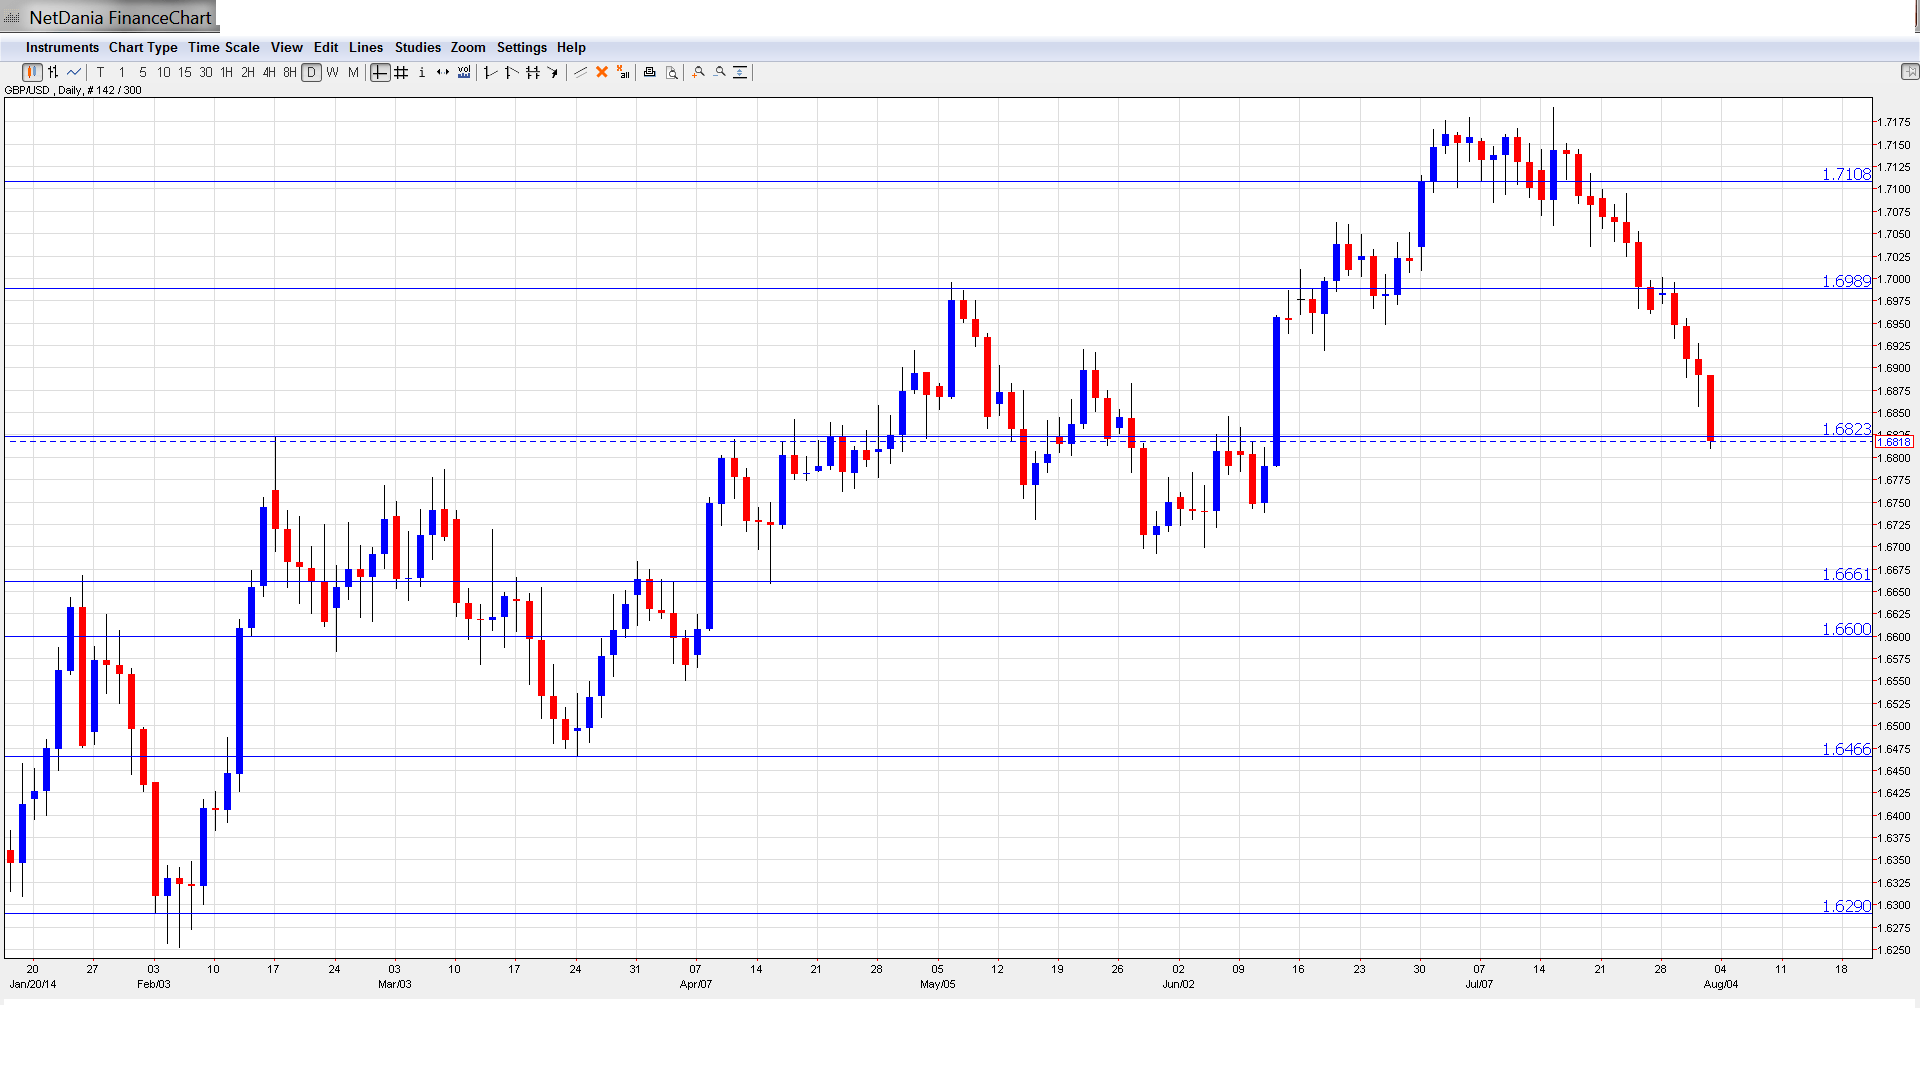
[do action=”autoupdate” tag=”GBPUSDUpdate”/]GBP/USD graph with support and resistance lines on it. Click to enlarge:
- Construction PMI: Monday, 8:30. PMIs are considered important gauges of the health of key sectors in the economy. Construction PMI continues to point to expansion and rose to 62.6 points last month. Another strong release is expected for June, with an estimate of 62.1 points.
- Halifax HPI: Tuesday, 5th-8th. This index provides a snapshot of activity in the UK housing sector. In the previous release, the indicator disappointed with a decline of 0.6%. The markets are expecting a turnaround in July, with the forecast calling for a 0.5% gain.
- Services PMI: Tuesday, 8:30. Services PMI remains in the high-50s range, pointing to strong expansion in the services sector. However, the index did soften last month, coming in at 57.7 points, shy of the estimate of 58.1. The estimate is unchanged for the upcoming reading, at 58.1 points.
- BRC Shop Price Index: Tuesday, 23:01. This indicator measures inflation in BRC stores. The index continues to post declines, coming in at -1.8% last month. No significant change is expected in the upcoming release.
- Manufacturing Production: Wednesday, 8:30. This key indicator can have a major impact on the movement of GBP/USD. The indicator disappointed in June, with a sharp decline of 1.3%. The markets are expecting a strong turnaround in the upcoming release, with an estimate of 0.7%.
- NIESR GDP Estimate: Wednesday, 14:00. The GDP Estimate, published monthly, is useful for tracking official GDP figures, which are only released each quarter. The indicator continues to post impressive gains, with two straight readings of 0.9%.
- BOE Asset Purchase Facility: Thursday, 11:00. The BOE has maintained its QE level at 375 billion since July 2012. The markets are not expecting any change in the August decision.
- BOE Official Bank Rate: Thursday, 11:00. With the UK’s economic recovery continuing, there has been increased speculation about a rate hike, possibly before the end of the year. For the time being, the BOE is expected to keep rates at the current level of 0.50%. The MPC will release a Rate Statement announcing the July rate.
- Trade Balance: Thursday, 8:30. Trade Balance is closely linked to currency demand, as foreigners must purchase British pounds in order to purchase UK exports. The UK continues to post trade deficits, with the previous release coming in at GBP -9.2 billion, which was within expectations. The estimate for the upcoming release stands at GBP -8.9 billion.
* All times are GMT
GBP/USD Technical Analysis
GBP/USD opened the week at 1.6981 and rose slightly to a high of 1.7001. It was all downhill after that, as the pair tumbled to a low of 1.6810, breaking below support at 1.6823. GBP/USD closed the week at 1.6818.
Live chart of GBP/USD:
[do action=”tradingviews” pair=”GBPUSD” interval=”60″/]
Technical lines from top to bottom
With the pound continuing to lose ground, we start at lower levels:
There is resistance at 1.7465. This line has held firm since October 2008. 1.7375 is the next resistance line.
1.7191 was last tested in mid-July. This line marked the high point of a strong rally which began last August, when the pound was trading around 1.52.
1.7108 continues to provide strong support.
1.6989 was breached early in the week but recovered as the pound took a sharp dive. It starts the week as strong resistance.
1.6823 has switched to a resistance line, as the pair begins the week just shy of this level. It could see further action early in the week.
1.6669 is providing strong support.
Next is the round number of 1.6600. It has remained intact since early April, which marked the start of a rally that saw the pound flirt with the 1.70 line.
1.6466 marked the bottom of a reverse head-and-shoulders in March.
1.6290 is the final support level for now. It has remained intact since early February.
I am bearish on GBP/USD.
It’s been a July to forget for the British pound, as the currency plunged almost 300 points and is struggling to stay above the 1.68 line. Market sentiment remains supportive of the US dollar, as QE continues and there are expectations for a rate increase in the near future. If British PMIs do not meet expectations, we could see the pound head further south.
Further reading:
- For a broad view of all the week’s major events worldwide, read the USD outlook.
- For EUR/USD, check out the Euro to Dollar forecast.
- For the Japanese yen, read the USD/JPY forecast.
- For the Australian dollar (Aussie), check out the AUD to USD forecast.
- For USD/CAD (loonie), check out the Canadian dollar forecast.
