For a second straight week, AUD/USD showed little movement, as the pair closed at 0.9316. This week’s major events focus on the RBA. The central bank will release its Monetary Policy Meeting Minutes and Governor Glen Stevens is scheduled to testify before a parliamentary committee. Here is an outlook on the major market-movers and an updated technical analysis for AUD/USD.
Australian data was solid last week, led by a strong jump in NAB Business Confidence. In the US, key consumer indicators disappointed, as retail sales and consumer sentiment numbers softened in July.
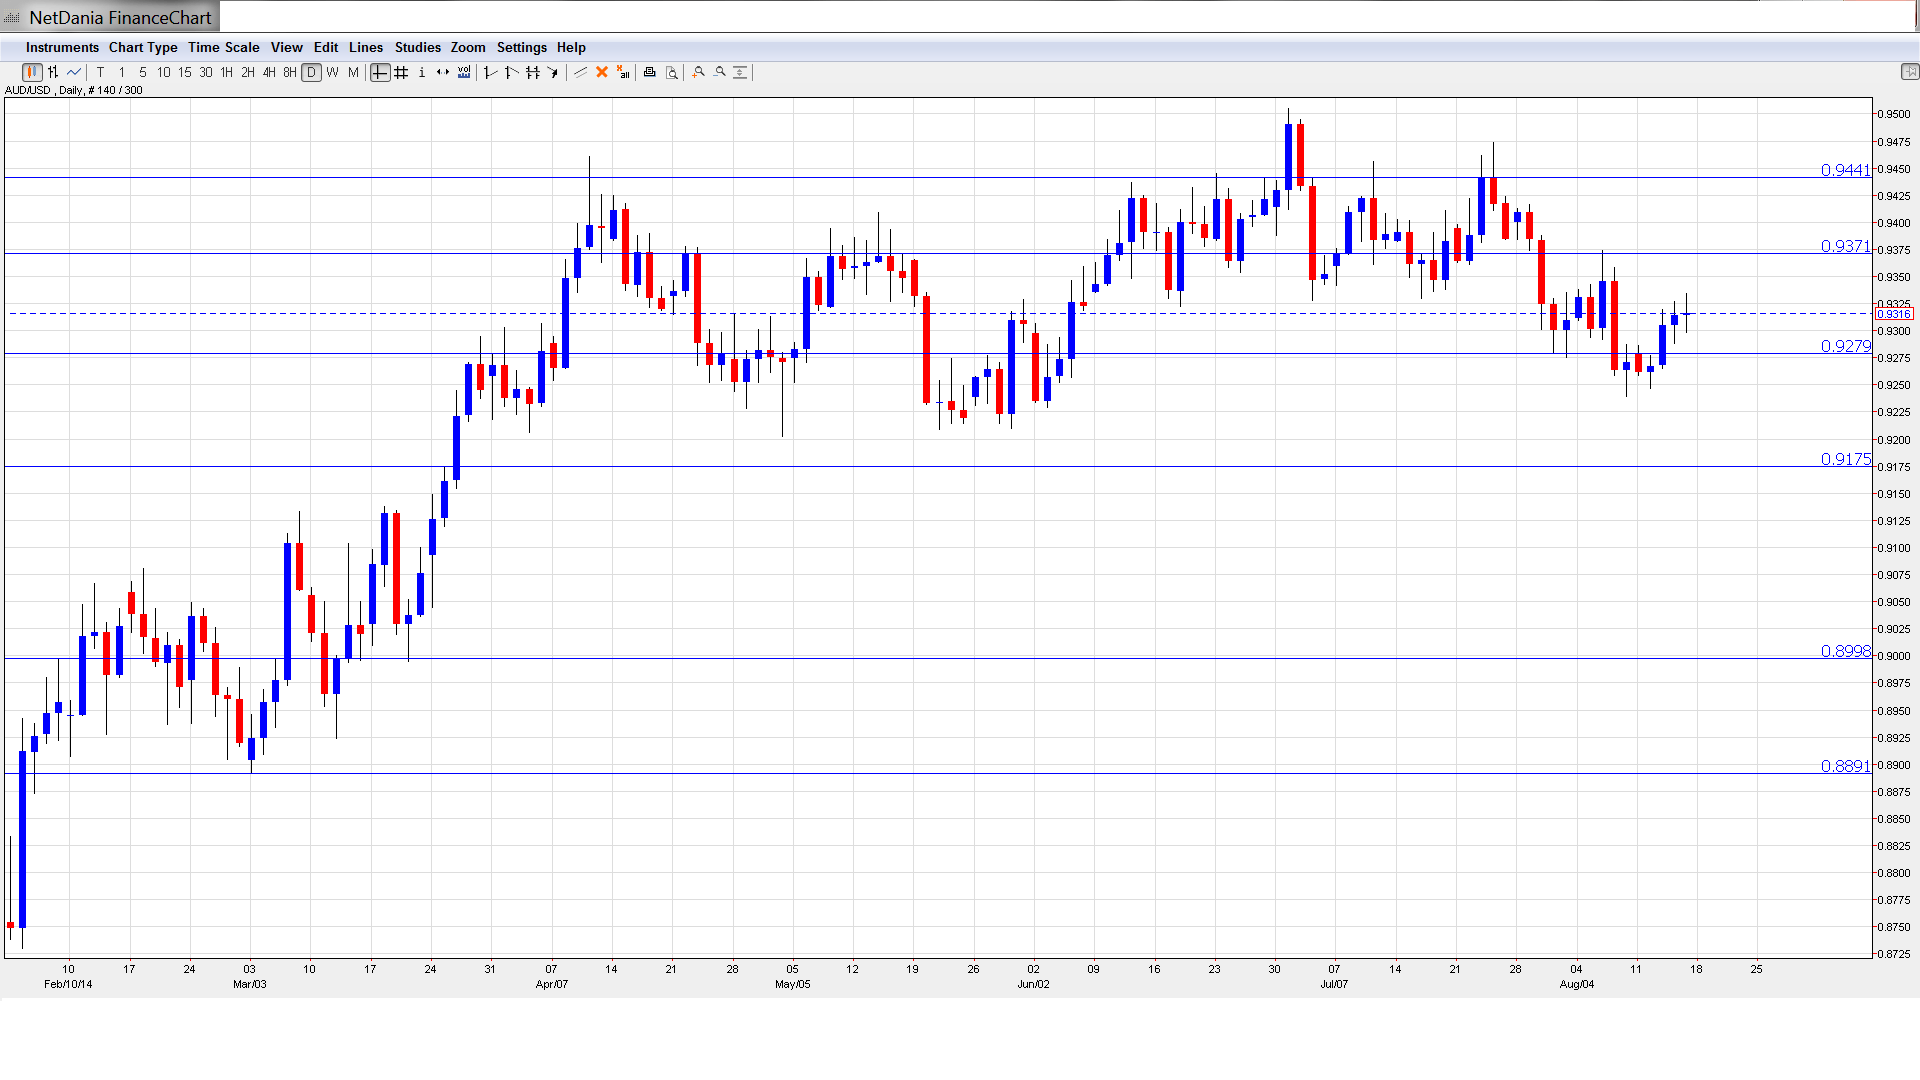
[do action=”autoupdate” tag=”AUDUSDUpdate”/]AUD/USD graph with support and resistance lines on it. Click to enlarge:
- New Motor Vehicles Sales: Monday, 1:30. This indicator is an important gauge of consumer spending, as increased demand for big-ticket items such as cars and trucks points to stronger consumer confidence and spending. The indicator jumped 1.7% in June, its strongest gain this year. Will the indicator post another sharp gain in July?
- RBA Monetary Policy Meeting Minutes: Tuesday, 1:30. This is the key release of the week. The minutes provide a detailed record of the RBA’s most recent policy meeting. The value of the Australian dollar is often discussed at the meetings, so the minutes could have an effect on the direction of AUD/USD.
- RBA Governor Glenn Stevens Speaks: Tuesday, 23:30. Stevens is scheduled to testify before the House of Representatives Standing Committee on Economics in Brisbane. The markets will be listening closely, looking for clues regarding the RBA’s future monetary policy.
- MI Leading Index: Wednesday, 00:30. This index is based on 9 economic indicators, but is considered a minor event since most of the data has already been released. The indicator has been steady, posting gains of 0.1% in the past two readings.
- CB Leading Index: Thursday, 00:00. This index is based on 7 economic indicators, and can affect the movement of AUD/USD. The index has not shown strong gains in 2014, and posted a 0.2% gain in June.
* All times are GMT.
AUD/USD Technical Analysis
AUD/USD opened the week at 0.9278 and quickly dropped to a low of 0.9247. The pair then reversed directions, climbing to a high of 0.9334, as resistance at 0.9369 discussed last week) held firm. AUD/USD closed the week at 0.9316.
Live chart of AUD/USD: [do action=”tradingviews” pair=”AUDUSD” interval=”60″/]
Technical lines from top to bottom:
We begin with resistance at 0.9757. This line marked the start of a rally by the US dollar back in October 2013, which saw the pair drop as low as 0.8650.
This is followed by the round number of 0.9622, which has held firm since October 2013.
0.9526 provided key resistance in November 2013 and has remained intact since that time.
0.9441 marked the high point of the pair in November, which saw the Aussie go on a sharp slide and drop below the 0.89 line.
0.9369 held firm as the pair climbed higher during the week.
0.9279 is an immediate support line and could see action early in the week.
0.9175 continues to provide strong support.
The round number of 0.9000 is a key psychological level. It has remained intact since early March.
0.8891 is the final support level for now. It has provided strong support since February.
I am neutral on AUD/USD.
The Australian dollar is known for taken traders on wild roller coaster rides, but the currency has stayed close to the 0.93 level in August. We could well see more of the same from AUD/USD next week. At the same time, traders should keep a close eye as the RBA and Federal Reserve release their minutes, which could affect the pair’s direction.
- For a broad view of all the week’s major events worldwide, read the USD outlook.
- For EUR/USD, check out the Euro to Dollar forecast.
- For the Japanese yen, read the USD/JPY forecast.
- For GBP/USD (cable), look into the British Pound forecast.
- For the Australian dollar (Aussie), check out the AUD to USD forecast.
- USD/CAD (loonie), check out the Canadian dollar.
