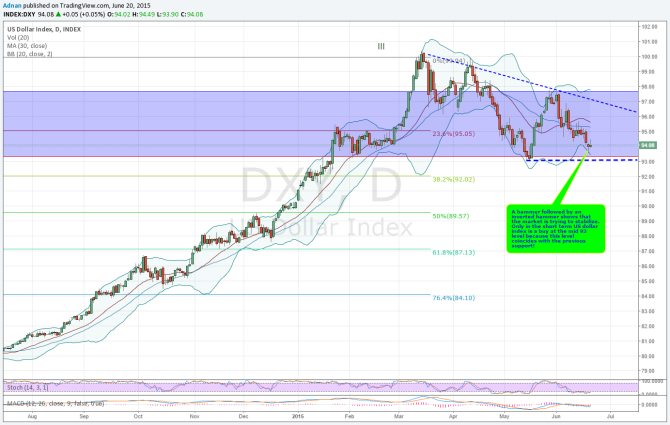
The overall bias on the US$ index still is down albeit its effort to stabilize on the daily chart. The stabilization appears to be emerging with the hammer and inverted hammer formations near the support region of 93. Given the fact that there have been many bearish engulfing patterns continuously exerting a downward momentum on the index, the hammer formations would surely need a confirmation pattern before short term traders may consider taking a slightly bullish stance on the US$.
But then again, it would be only prudent to have a short term positive outlook. If indeed the US$ index is charting an intermediate corrective pattern, as may be more apparent by the weekly chart, then 96-97 may be a zone of resistance and even a sell zone. Further given the fact that stochastic is oversold but the MACD relatively neutral, a target of 97 appears to be viable.
Guest post by Adnan Khurshid of Technical Forex
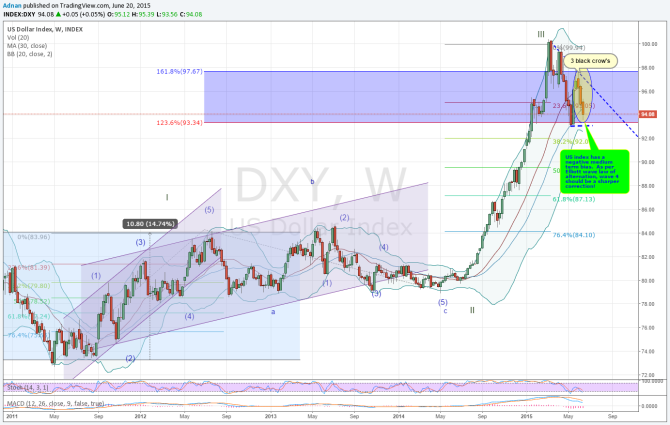
The weekly chart delineates a negative medium term bias given the fact that the three falling candles are the bearish “three black crows” which really presage an overall bearish outlook for the US dollar index. If law of alternation is to prevail that the 4th Elliott wave correction may just be a sharper one than what some might expect, as wave 2 was a sideways channel.
Therefore, there is much to unfold in terms of how the US$ will behave against many of its counterpart currencies and by the looks of it, the US$ Index will continue to struggle as it charts through its corrective phase. But having said this, traders may have something to gain in the short term.
In our latest podcast we digest the dollar dove dive, update on Greece and preview next week’s events.
