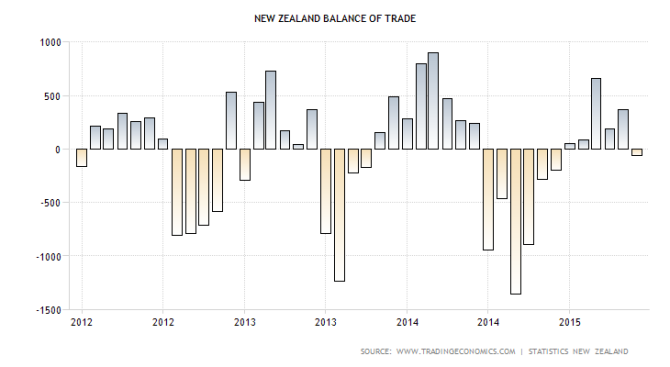
Like most of its neighbors in the Asia-Pacific region, New Zealand has an export economy. However, as the chart demonstrates, New Zealand’s balance of trade seems to swing between trade surpluses and deficits over the past several years.
Guest post by Mike Scrive of Accendo Markets
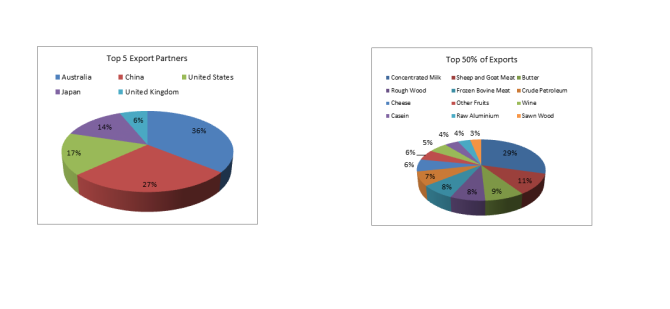
The five largest of New Zealand’s export partners account for nearly 55% of total exports. In the top 50% of total exports, over 78% are consumer staple agricultural products. Of that 37.72% is concentrated milk; overall 62% are dairy based products.
Although it might appear that New Zealand has minimal direct trade relation with the European Union, changes in European Dairy Product Regulations have had a negative impact on New Zealand’s dairy industry. Quotas were established in Europe over 30 years ago, when over production created ‘milk lakes and butter mountains’. However, over the past several years, demand from the Asia-Pacific region has driven the price of dairy exports up nearly 100%. It is often said that the road to ruin is paved with good intentions, and indeed this was the case here. Quotas were removed with the expectation that global demand would support prices. However, New Zealand was already established as the world’s largest dairy exporter but that’s not to say the world’s largest producer. For example, New Zealand’s Dairy Co-operative Fonterra (FSF:NZC) accounts for about 30% of global milk exports. In 2014 New Zealand produced 20.7 billion liters of milk. However, according to the US Department of Agriculture, New Zealand ranks 10th in global production and the EU 6th. The lifting of EU milk production quotas simply added to already robust production and supply causing prices to plummet and putting pressure on New Zealand’s China market share, for example by Argentina and Brazil, ranked number 1st and 3rd respectively in global production. Even in Europe, the effect was not as expected. Recently Eurozone dairy producers have voiced their frustration over the price collapse. Lastly, the timing of the quota lifting could not have been worse as New Zealand’s top two export partners Australia and China were experiencing contracting economic growth.
The point of the matter being that New Zealand’s export economy would also be affected. Before the dairy price collapse the RBNZ was able to maintain a relatively strong overnight cash deposit rate at 3.50%, and AA sovereign debt yielding well above the global average at the time. However, several economists voiced concerns over a lack of CPI growth and deflation concerns and indeed, CPI disappointed in February. However, the RBNZ held rates at the 11 March meeting based on GDP growth estimates in excess of 3.25%.
The Euro began to weaken against majors early in 2015 when the ECB established its €1 trillion bond purchasing QE program. Further affecting the Euro was a worsening situation in Greece as the recently elected Syriza party took a firm stance against the Troika. Pressure on the Euro continued into early March, hitting an 11 year low vs the US Dollar. EUR/NZD continued to trend towards its nine month low at 1.39927 Kiwi to Euro in late April. However, the reversal from that April low would be dramatic in spite of the ECB QE and the increasingly serious Greek Crisis.
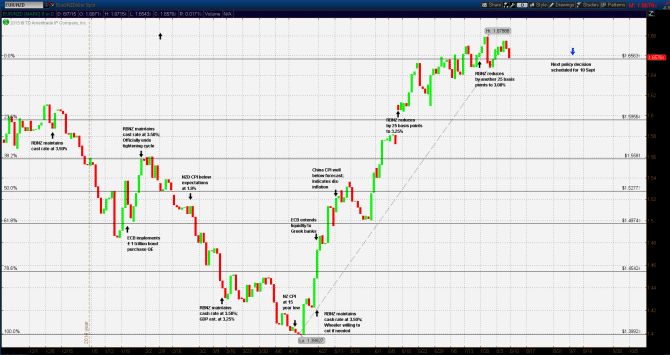
The sharp reversal reflects the double impact of the slowing China and Australian economy and the collapse of dairy prices. In early April, the Kiwi reached a virtual parity with the Aussie for a time. It should be noted that China and Australia account for well over 50% of New Zealand exports, particularly in crude oil and milk, two commodities now experiencing intense pricing pressures. The RBNZ held fast to the 3.50% cash rate at the 30 April meeting in spite of CPI at the lowest in 15 years.
From the 1.39927 EUR/NZD low, the Kiwi would decline nearly 20% against a weak Euro, to 1.67888 by August. The collapse of key commodity prices, milk in particular. Record declines in EU month over month CPI trumped the ECB stimulus and the potential Greek exit from the Eurozone. China’s CPI declines were also causing deflation concerns. The RBNZ reduced the cash rate at the 11 June meeting. It should be noted here that the ECB deposit facility is -0.20% creating a 345 basis point differential with the RBNZ cash rate. Hence, the Kiwi was weakening against an already devalued currency, with a promise to weaken further through the €60 billion per month bond buying program. Clearly, the market was pricing far more action from the RBNZ.
For example, Goldman Sachs’ analyst Tim Toohey noted that”…Last week we changed our view that the RBNZ would cut interest rates 50bps by calendar year end to a forecast of 100bps of easing over the same period and we placed our FX and GDP forecasts under review. Today we cut our GDP forecast for 2015 for NZ from 3.1% to 2.3%…”
Indeed, at the 23 July meeting the RBNZ opted for another 25 basis point cut to 3.00%. In Europe, the Greece-ECB standoff reached a critical juncture with a possible permanent resolution, (although not yet finalized). Otherwise, the Eurozone economy, if not expanding, seems to have stabilized with small but positive CPI data, and improving employment.
What this narrative indicates is that at the beginning of 2015 the RBNZ reacted properly for the data at hand at that time. What ‘undermined’ the RBNZ strategy was a confluence of negative events: a far worse than expected slowdown with their two best trading partners and a bad miscalculation by EU regulators which led to a collapse of dairy prices.
With the Euro priced for continuing QE, there are three possibilities: the Asia-Pacific economic situation will stabilize and improve, stabilize and remain flat, continue to deteriorate. In all three scenarios, the RBNZ may still need to cut to stimulate the domestic economy as well as the export economy, particularly to make its milk export prices more competitive.
“CFDs, spread betting and FX can result in losses exceeding your initial deposit. They are not suitable for everyone, so please ensure you understand the risks. Seek independent financial advice if necessary. Nothing in this article should be considered a personal recommendation. It does not account for your personal circumstances or appetite for risk.“
