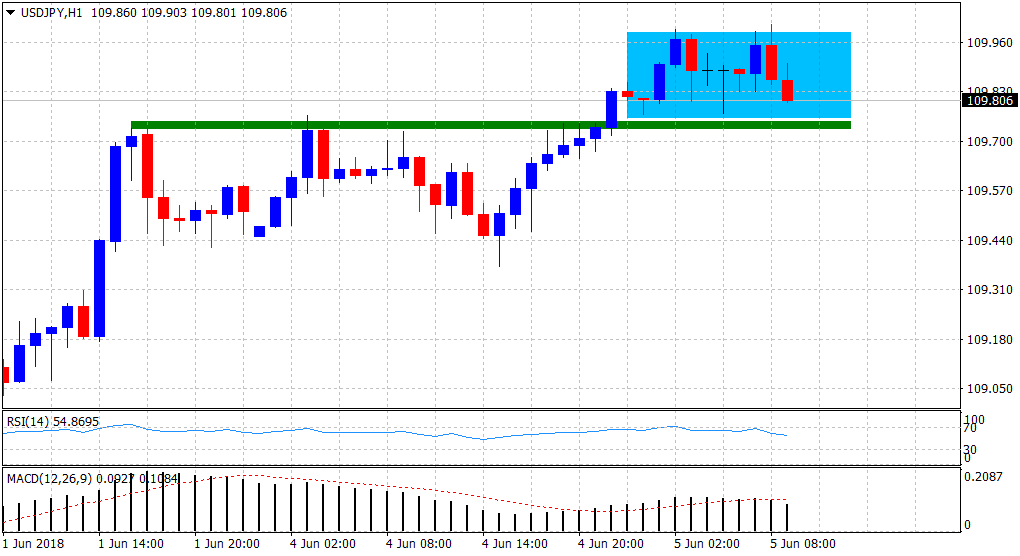
“¢ Formation of a rectangular chart pattern on hourly charts suggest consolidation just below the psychologically important 110.00 mark and the very important 200-day SMA.
“¢ Short-term technical indicators hold in bullish territory and further add credence to the near-term positive outlook.
“¢ Sustained break below 109.75-70 horizontal zone might negate bullish view and prompt some long-unwinding weakness.
Spot Rate: 109.81
Daily High: 110.00
Trend: Bullish
Resistance
R1: 110.00 (session high and R1 daily pivot-point)
R2: 110.17 (Friday’s swing high)
R3: 110.46 (May 25th daily swing high)
Support
S1: 109.60 (50-period SMA H1)
S2: 109.19 (S1 daily pivot-point
S3: 109.00 (round figure mark)
