Home USD/JPY Technical Analysis: Technical weakness building up as bull run continues
FXStreet News

USD/JPY Technical Analysis: Technical weakness building up as bull run continues

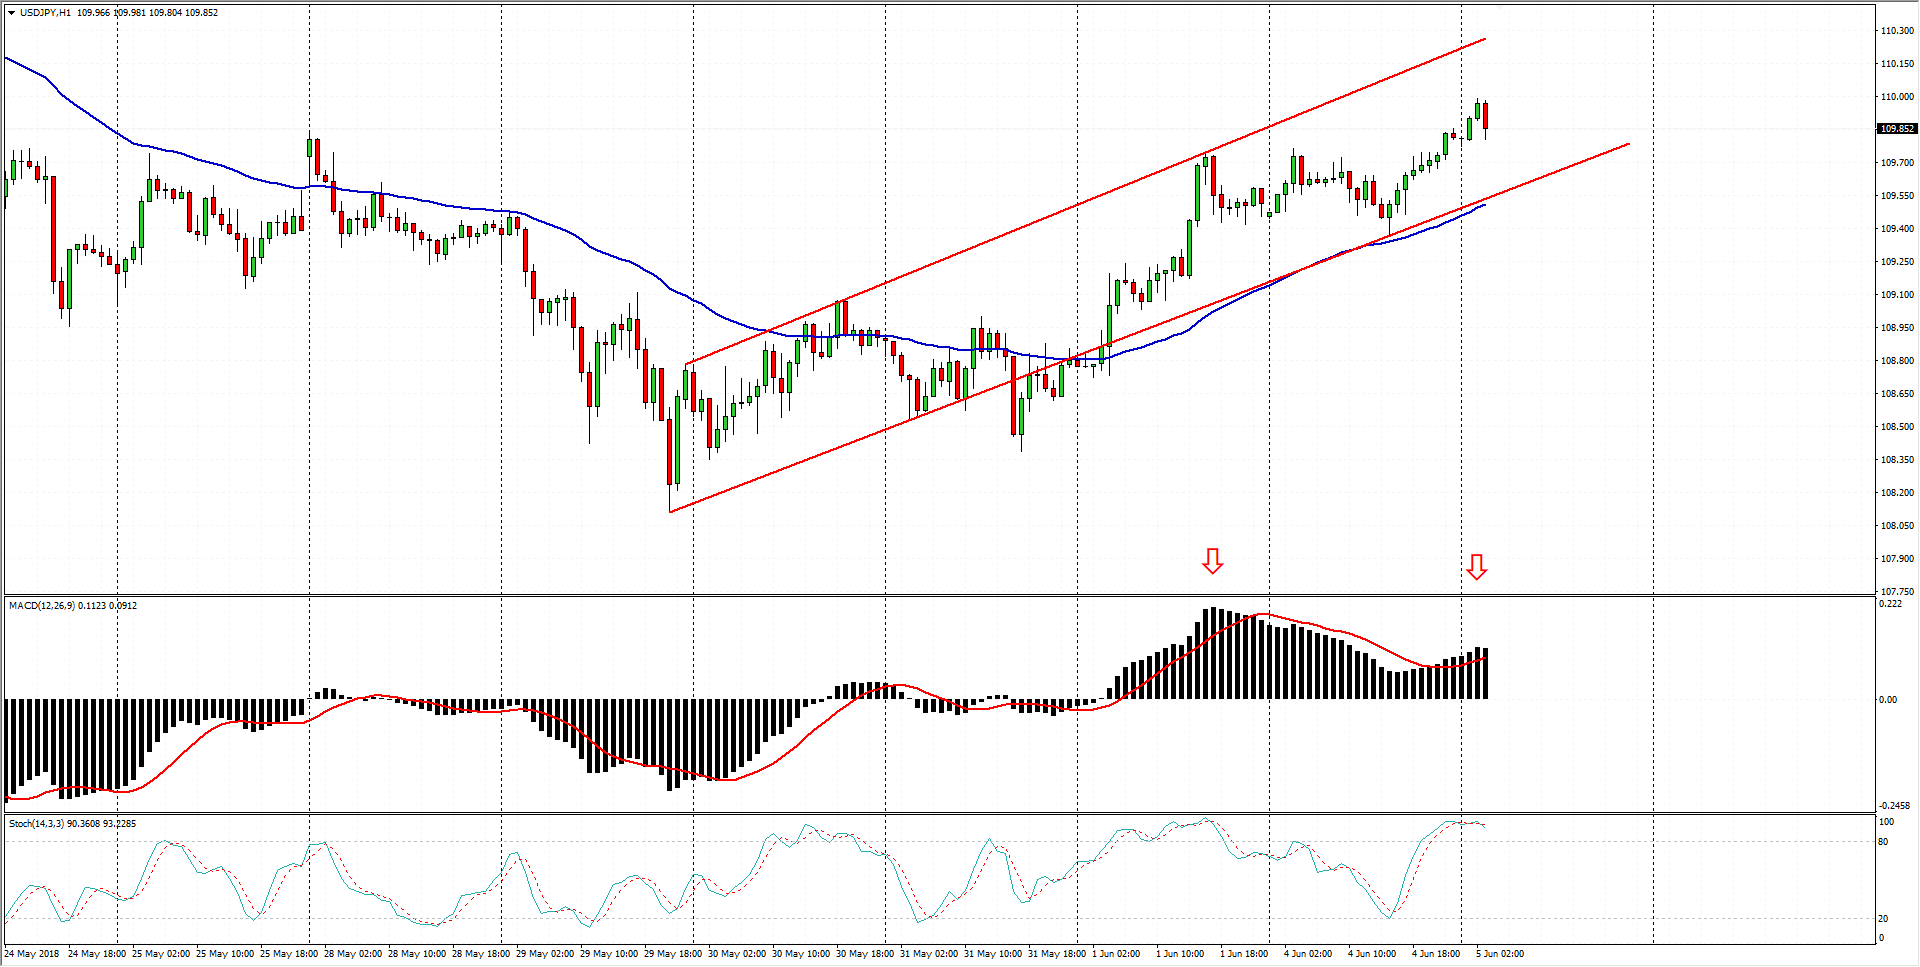
  • USD/JPY trading higher as market risk appetite remains bid.
  • MACD, Slow Stochastics both beginning to rollover in overbought territory.
  • Bearish MACD divergence indicating a softening in buying action.

USD/JPY Chart, 1-Hour

Spot price: 109.85
Relative change: 0.04%
High: 110.00
Low: 109.77

Trend: Bullish

Support 1: 109.52 (50-hour EMA)
Support 2: 109.37 (week’s low)
Support 3: 108.72 (month’s low)

Resistance 1: 110.00 (day’s high, major handle)
Resistance 2: 110.50 (R3 1-Day pivot)
Resistance 3: 111.40 (May swing high)
FX Street

FX Street

FXStreet is the leading independent portal dedicated to the Foreign Exchange (Forex) market. It was launched in 2000 and the portal has always been proud of their unyielding commitment to provide objective and unbiased information, to enable their users to take better and more confident decisions.