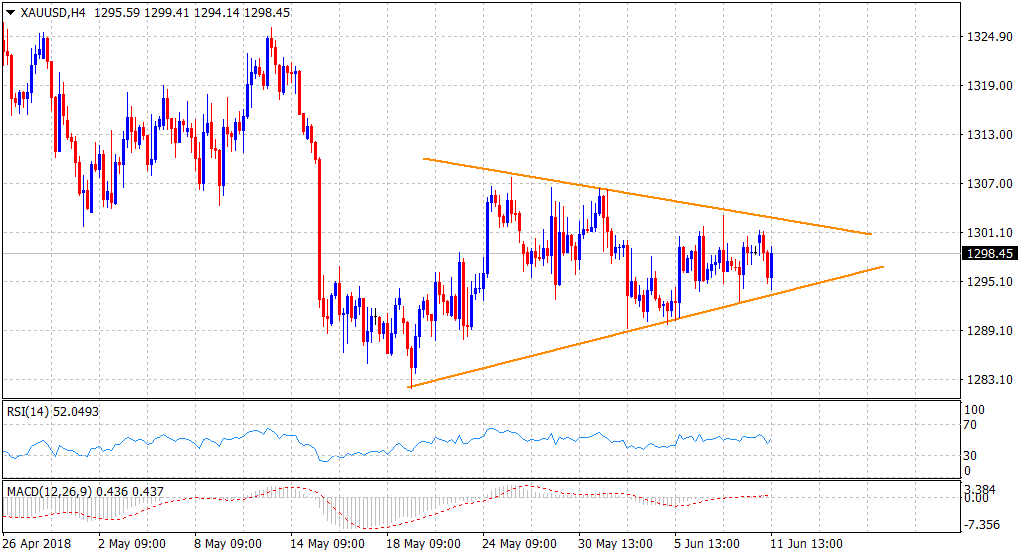
“¢ Has been oscillating between two converging trend-lines over the past three-weeks, forming a symmetrical triangle on 4-hourly chart and points to a consolidation phase before the next leg of a directional move.
“¢ The commodity’s inability to register any meaningful recovery from multi-month lows and acceptance below the very important 200-day SMA qualifies the contracting wedge as a bearish continuation pattern.
“¢ The negative bias would only be confirmed after a decisive break below the pattern support, currently near the $1293 region, albeit a move beyond 200-day SMA would invalidate the bearish outlook.
Spot Rate: $1298.45
Daily High: $1301.30
Daily Low: $1294.14
Trend: Range-bound
Resistance
R1: $1303.50 (last Thursday’s swing high)
R2: 1306.05 (50-day SMA)
R3: 1313.51 (200-day SMA)
Support
S1: $1294.14 (daily low touched during the European session)
S2: $1289.65 (last Tuesday’s swing low)
S3: $1281.70 (multi-month lows set on May 21)

