“¢ The pair has been oscillating within a broader trading range over the past one-week or so, forming a rectangular chart pattern on short-term charts.
“¢ Neutral short-term technical indicators make it prudent to wait for a decisive break in either direction.
“¢ Inability to gain positive traction beyond mid-0.7000s could be seen as initial signs of bullish exhaustion.
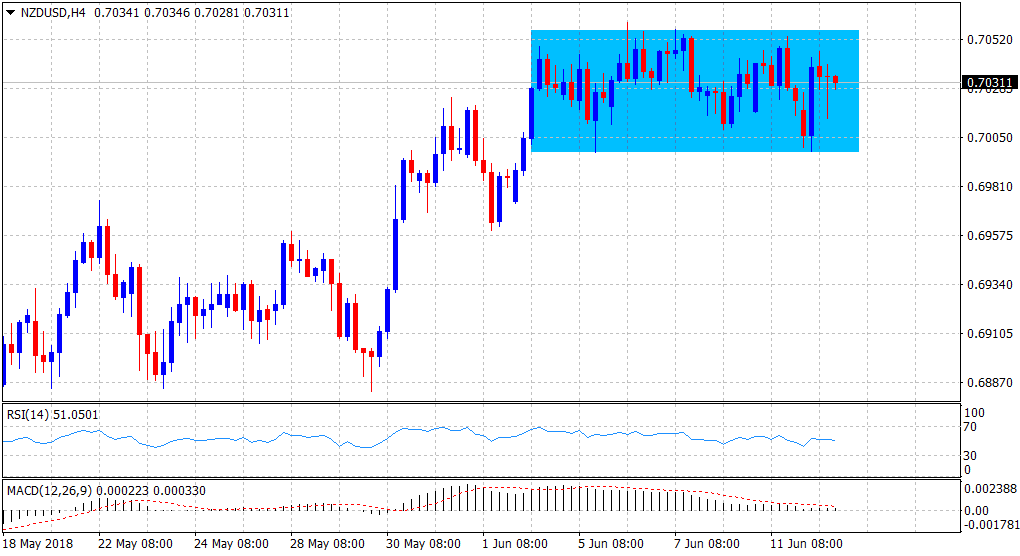
Spot Rate: 0.7043
Daily High: 0.7054
Daily Low: 0.7017
Trend: Indecisive
Resistance
R1: 0.7060 (June 6 swing high)
R2: 0.7087 (R3 daily pivot-point)
R3: 0.7124 (200-day SMA)
Support
S1: 0.7000 (psychological round figure mark)
S2: 0.6970 (S3 daily pivot-point)
S3: 0.6959 (20-day SMA)
