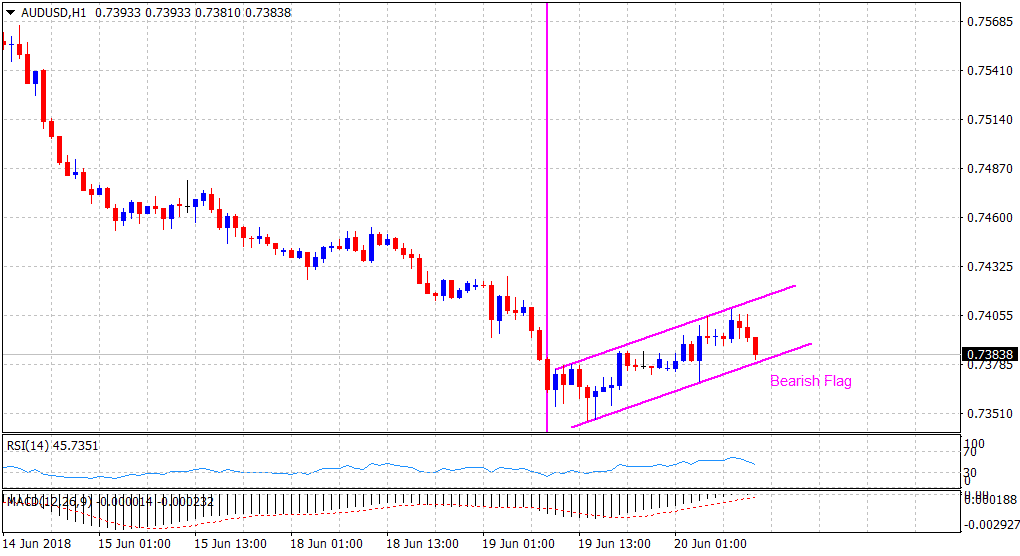
“¢ Intraday retracement extends to test a short-term ascending trend-channel support, forming a part of a bearish flag on the 1-hourly chart.
“¢ A follow-through selling would set the stage for a retest of 13-month through set in the previous session en-route May 2017 monthly swing low.
“¢ Short-term technical indicators, however, have failed to reinforce the bearish bias and might thus, help limit deeper fall, at least for the time being.
Current Price: 0.7400
Daily High: 0.7408
Daily Low: 0.7369
Trend: Bearish
Resistance
R1: 0.7398 (50-period SMA H1)
R2: 0.7415 (ascending trend-channel)
R3: 0.7427 (overnight swing high)
Support
S1: 0.7347 (13-month lows set yesterday)
S2: 0.7329 (May 2017 swing low)
S3: 0.7304 (S2 daily pivot-point)
