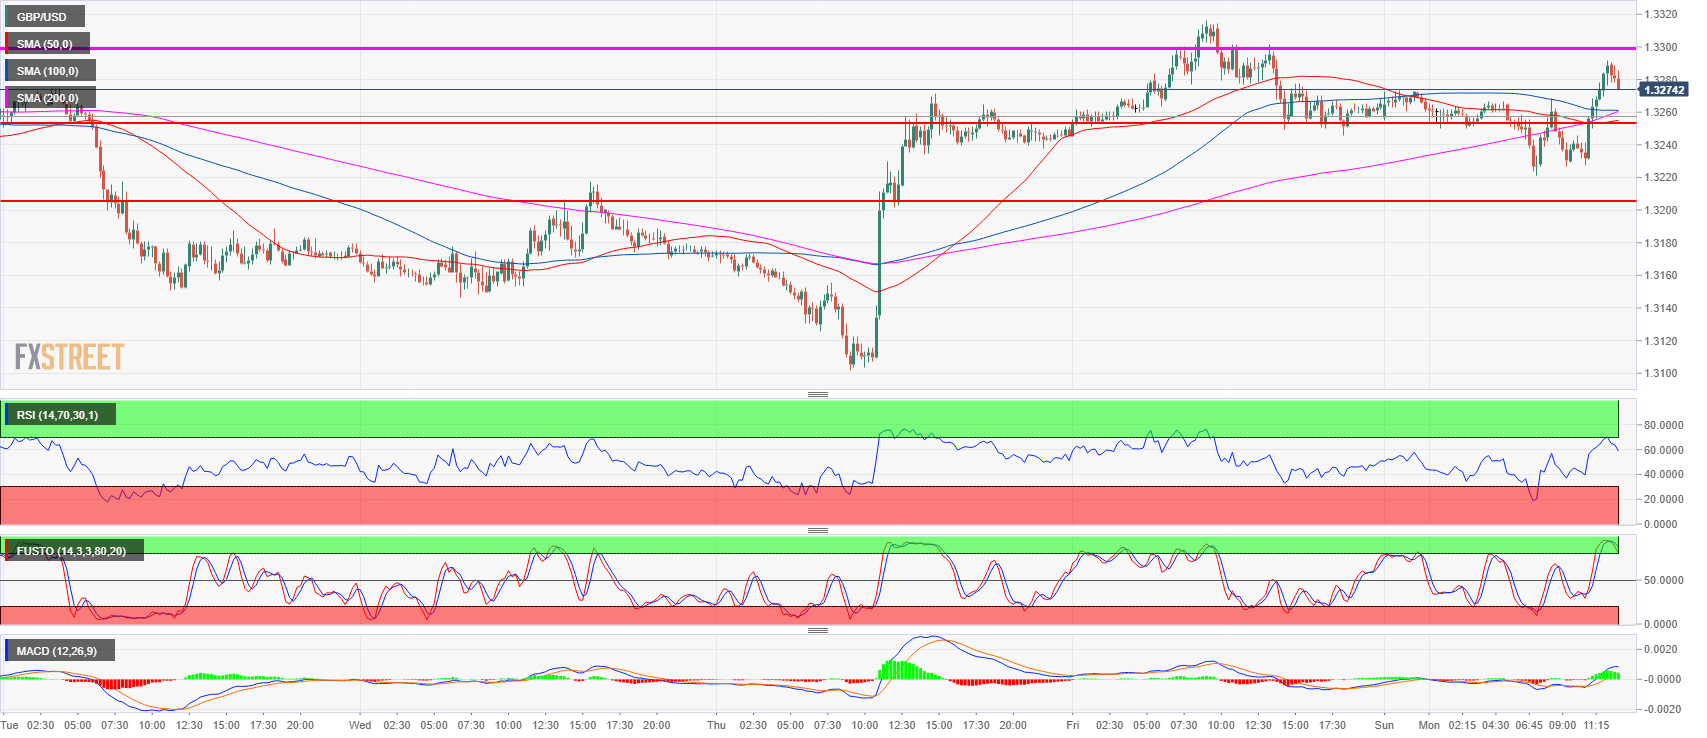
- GBP/USD has found intraday support above the 1.3221 level and the bulls are now currently capped by the 1.3300 figure resistance.
- GBP/USD made a false bear breakout as it almost reached the 1.3200 level in early Europe by reaching the 1.3221 level.
- A breakout above 1.3300 might lead to a move towards the 1.3350 previous supply/demand level while a failure at 1.3300 can lead to a retest of the 1.3260 level, the 200-period simple moving average on the 15-minute chart.
Spot rate: 1.3278
Relative change: 0.10%
High: 1.3291
Low: 1.3221
Trend: Bullish
Resistance 1: 1.3300 key support
Resistance 2: 1.3350 supply/demand level
Resistance 3: 1.3400 figure
Support 1: 1.3260, 200-period SMA (15m)
Support 2: 1.3200-1.3221 area, figure and current Monday’s low
Support 3: 1.3146, current 2018 low
