“¢ Confirms a bearish break through a medium-term ascending trend-line, extending from extending from Jan. 2017 lows through lows touched in July/Dec. 2017.
“¢ An occurrence of a death cross on the daily chart (50-day SMA crossing the very important 200-day SMA from the top) adds credence to a fresh bearish breakdown.
“¢ Formation of a descending trend-channel on the 1-hourly suggests an extension of the steady decline, though near-term oversold conditions might help limit sharp downfall.
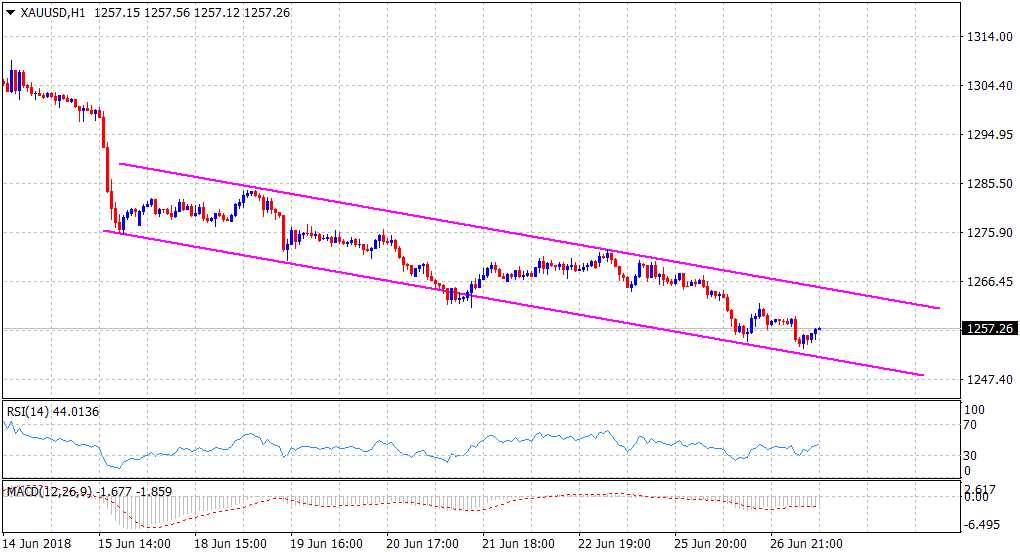
Spot Rate: $1257.26
Daily Low: $1253.45
Daily High: $1259.54
Trend: Bearish
Resistance
R1: $1265 (top-end of the descending trend-channel)
R2: $1268 (overnight swing high)
R3: $1273 (38.2% Fib. level of the $1123-$1366 rally)
Support
S1: $1253 (descending trend-channel support)
S2: $1247 (horizontal level)
S3: $1242 (Dec. 2017 daily closing low)
