GBP/USD is falling to fresh 2018 lows after the release of the US Gross Domestic Product and the Personal Consumption Expenditure. The macroeconomic data came in mixed.
GBP/USD bear momentum is strong as Cable is trading below its 200-period simple moving average, the next scaling point to the downside is seen near 1.3027, October 6, 2017 swing low while key resistance is seen at the 1.3100 figure.
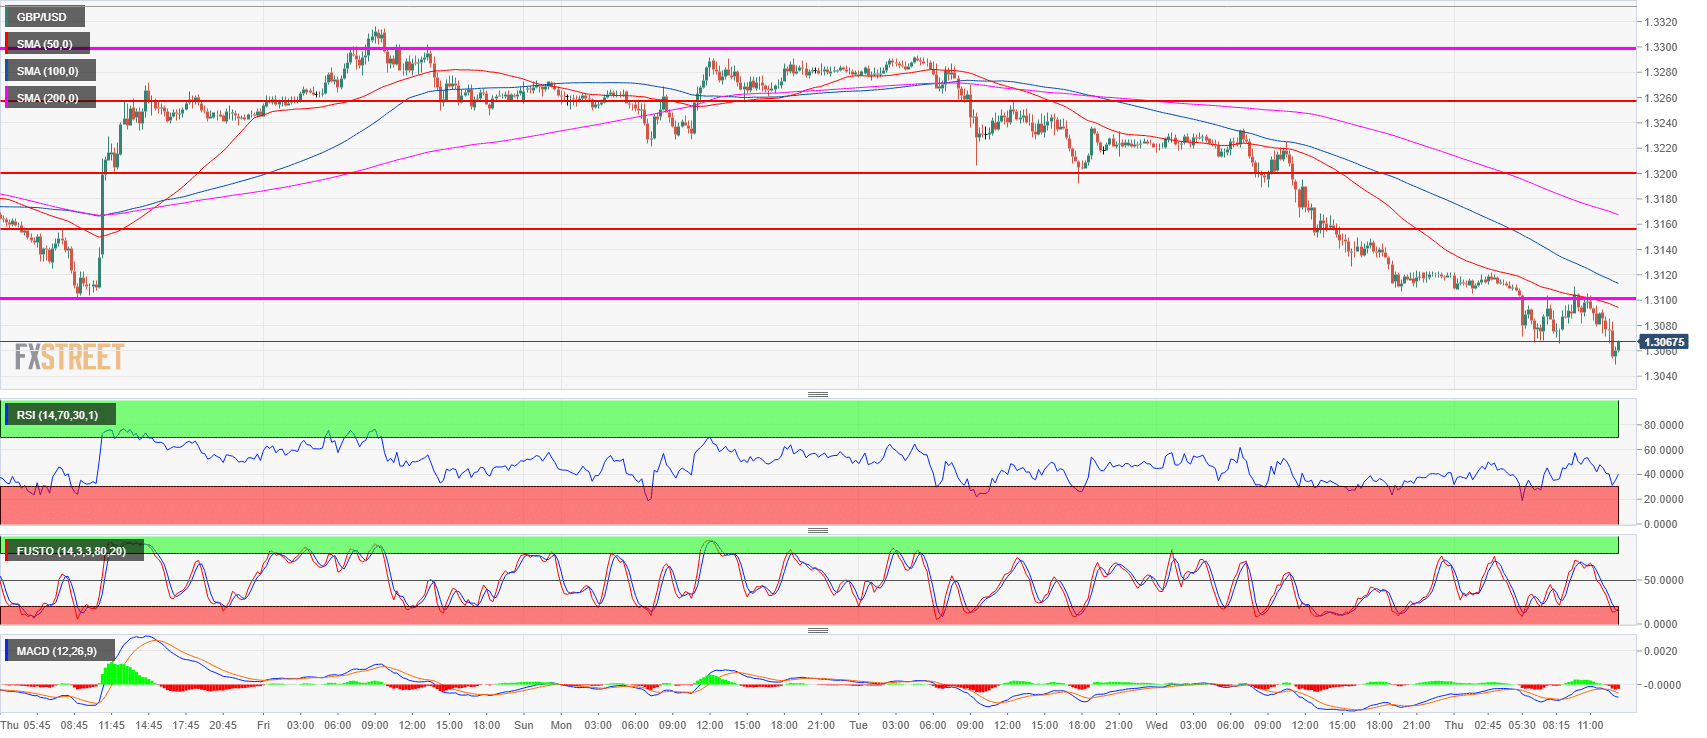
Spot rate: 1.3067
Relative change: -0.34%
High: 1.3123
Low: 1.3049
Trend: Bearish
Resistance 1: 1.3100 figure
Resistance 2: 1.3155 former breakout point
Resistance 3: 1.3200 figure
Resistance 4: 1.3235 Tuesday’s high
Resistance 5: 1.3260, intraday swing high Tuesday
Support 1: 1.3049 current 2018 low
Support 2: 1.3027 October 6, 2017 swing low
Support 3: 1.2774, August 24, 2017 swing low
