“¢ Weaker US GDP print prompts fresh selling in the last hour from closer to a short-term descending trend-line resistance, constituting towards the formation of a pennant on the 4-hourly chart.
“¢ A follow-through weakness below 200-period SMA on the said chart might accelerate the slide further towards another ascending trend-line support, coinciding with 55-day SMA.
“¢ Short-term technical indicators haven’t moved much in either direction and hence, it would be prudent to wait for a convincing break before positioning for the next leg of directional move.
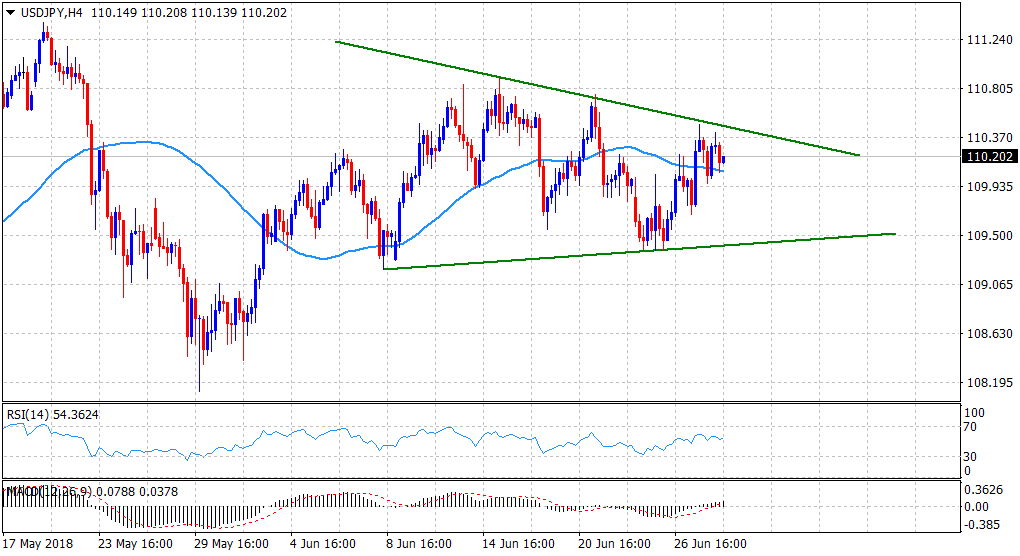
Spot Rate: 110.20
Daily Low: 109.97
Daily High: 110.42
Trend: Neutral
Resistance
R1: 110.49 (the descending trend-line hurdle)
R2: 110.76 (June 21 swing high)
R3: 111.00 (round figure mark)
Support
S1: 109.97 (current day low)
S2: 109.66 (50-day SMA)
S3: 109.32 (S3 daily pivot-point)
