- USD/JPY is pushing higher for the third day in a row. It has found resistance near the 110.62 supply level and is now in correction mode.
- Support is seen initially near the 110.40 supply/demand level and then 110.21 June 22 high.
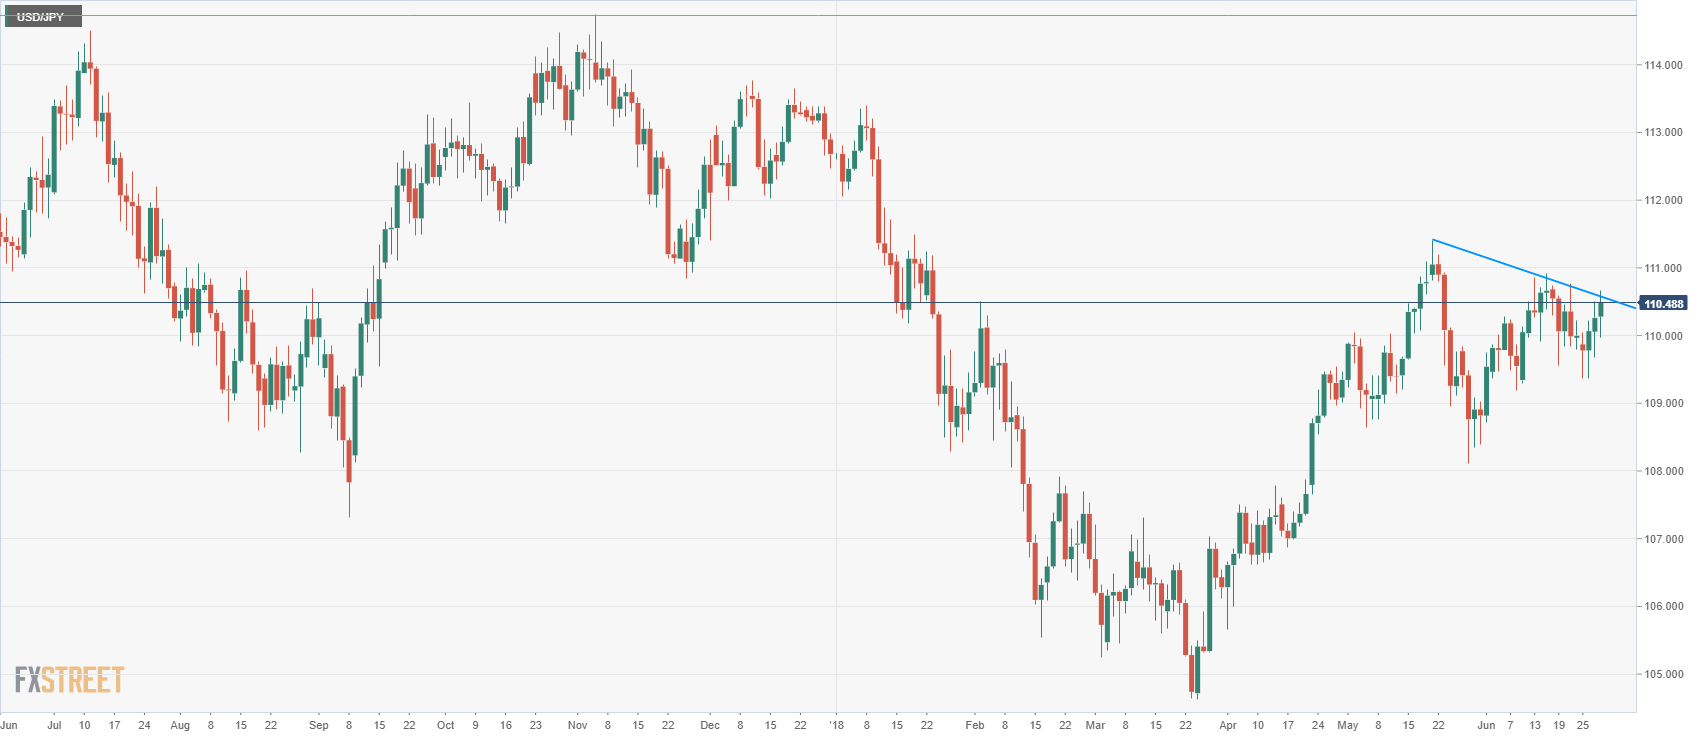
- USD/JPY reached a trend line on the daily chart which can provide some resistance in the short-term and a deeper pullback.
USD/JPY 15-minute chart
-636658159548688469.png)
Spot rate: 110.51
Relative change: 0.23%
High: 110.66
Low: 109.96
Trend: Bullish
Resistance 1: 110.62-75 supply level and June 21 high
Resistance 2: 110.90 June 15 swing high
Resistance 3: 111.39 May 21 swing high
Support 1: 110.40 supply/demand level
Support 2: 110.21 June 22 high
Support 3: 109.90-110.00 area supply level and figure
Support 4: 109.55 June 19 low
Support 5: 109.20 June 8 low
USD/JPY daily chart