- Dollar turns sharply lower for Friday after failing to push into new highs at familiar resistance.
- Too much, too fast could see a bullish correction with hourly candles marking sharply lower.
- A bullish continuation would see a higher low marked in, providing support for a move higher.
DXY Chart, 1-Hour
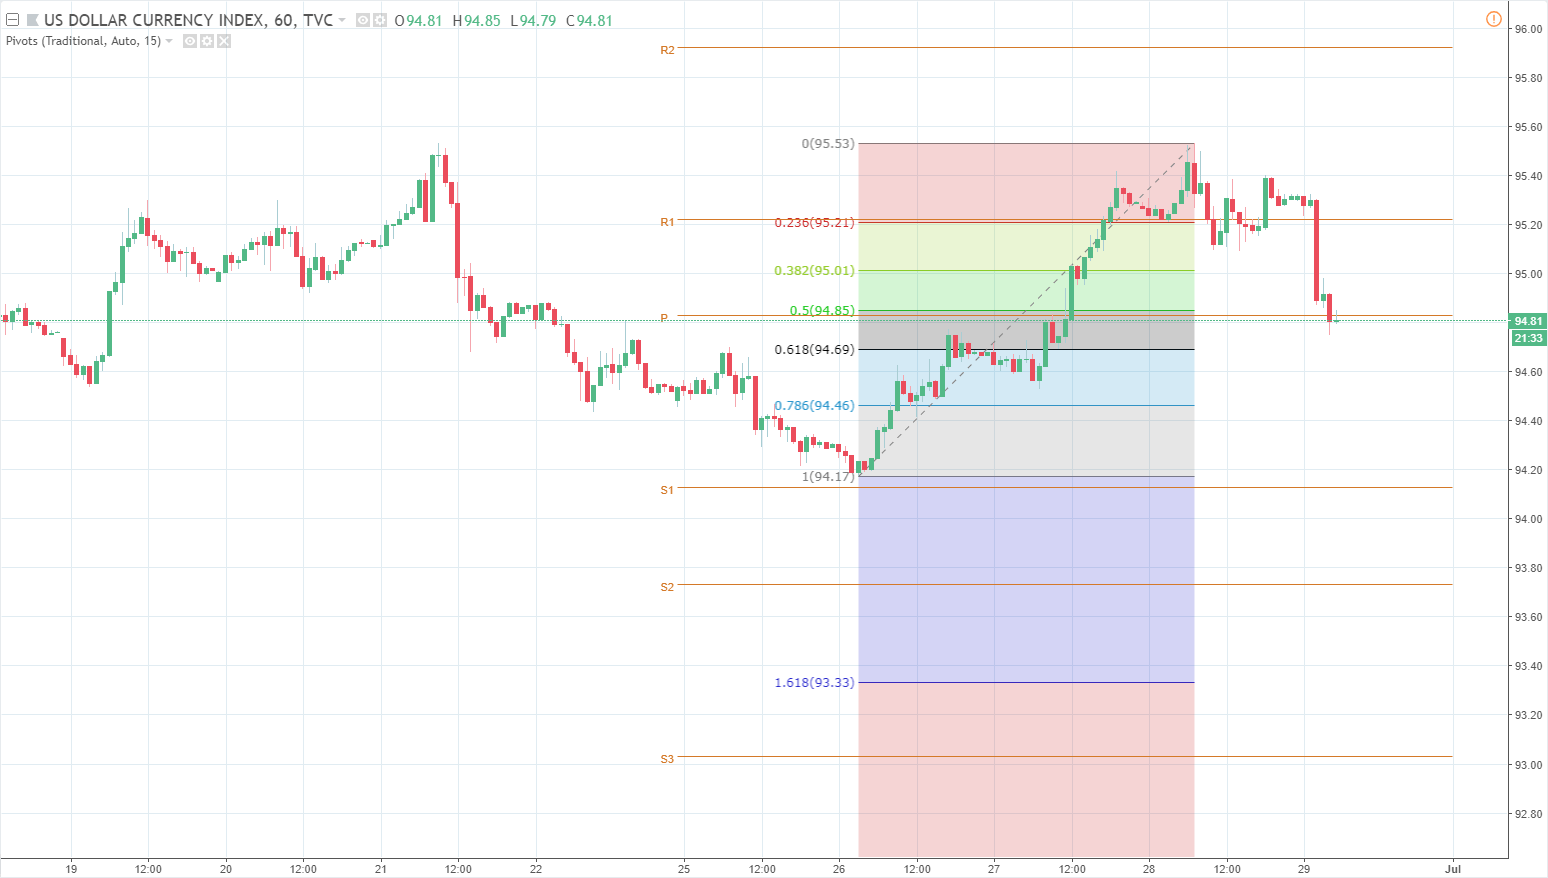
| Spot rate: | 94.81 |
| Relative change: | -0.52% |
| High: | 95.32 |
| Low: | 94.75 |
| Trend: | Bearish |
| Support 1: | 94.69 (61.8% one week Fibo level) |
| Support 2: | 94.17 (one week low) |
| Support 3: | 93.73 (S2 weekly pivot) |
| Resistance 1: | 95.21 (R1 weekly pivot) |
| Resistance 2: | 95.53 (one week high) |
| Resistance 3: | 95.92 (R2 weekly pivot) |
