“¢ The EU immigration deal-led bullish momentum stalls at an important horizontal level, which has been acting as a key hurdle over the past two weeks or so.
“¢ Given that the pair has already broken through a short-term descending trend-line resistance – drawn from highs touched on May 21 and June 15, any fall might now be looked upon as a buying opportunity.
“¢ Even short-term technical indicators are holding comfortably in bullish territory and further reinforce expectations of a follow-through up-move.
“¢ Only a decisive weakness back below the very important 200-day SMA might now negate the positive outlook.
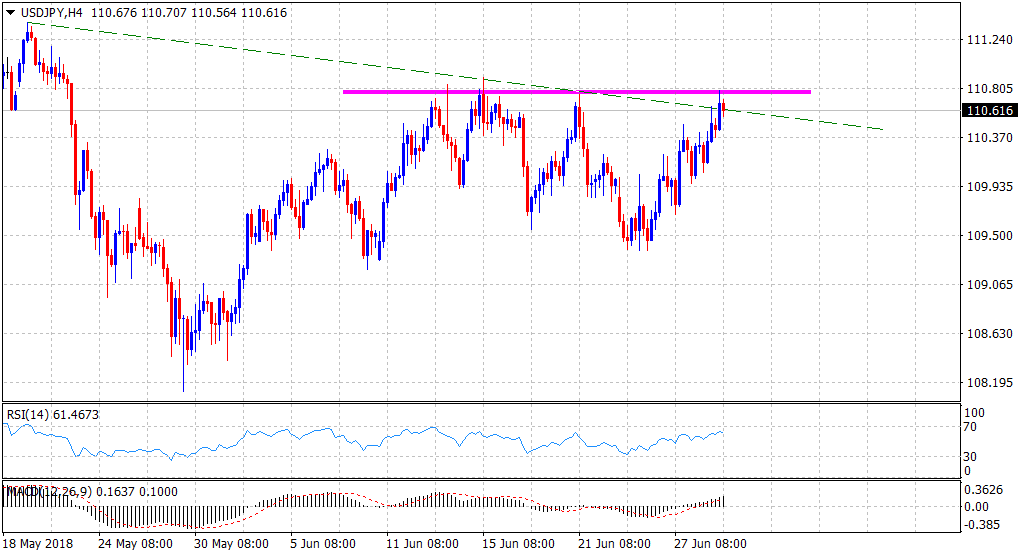
Spot Rate: 110.62
Daily Low: 110.38
Daily High: 110.79
Trend: Bullish
Resistance
R1: 110.80 (horizontal zone)
R2: 111.00 (round figure mark)
R3: 111.47 (R3 daily pivot-point)
Support
S1: 110.38 (current day low)
S2: 110.19 (200-day SMA)
S3: 110.00 (psychological mark)
