- AUD/USD daily chart shows a bullish price-relative strength index (RSI) divergence, but the options market isn’t buying the bullish technical signs.
- Risk reversals are still looking for a weaker AUD/USD.
The AUD/USD pair closed above 0.74 on Friday, confirming a bullish price-RSI divergence.
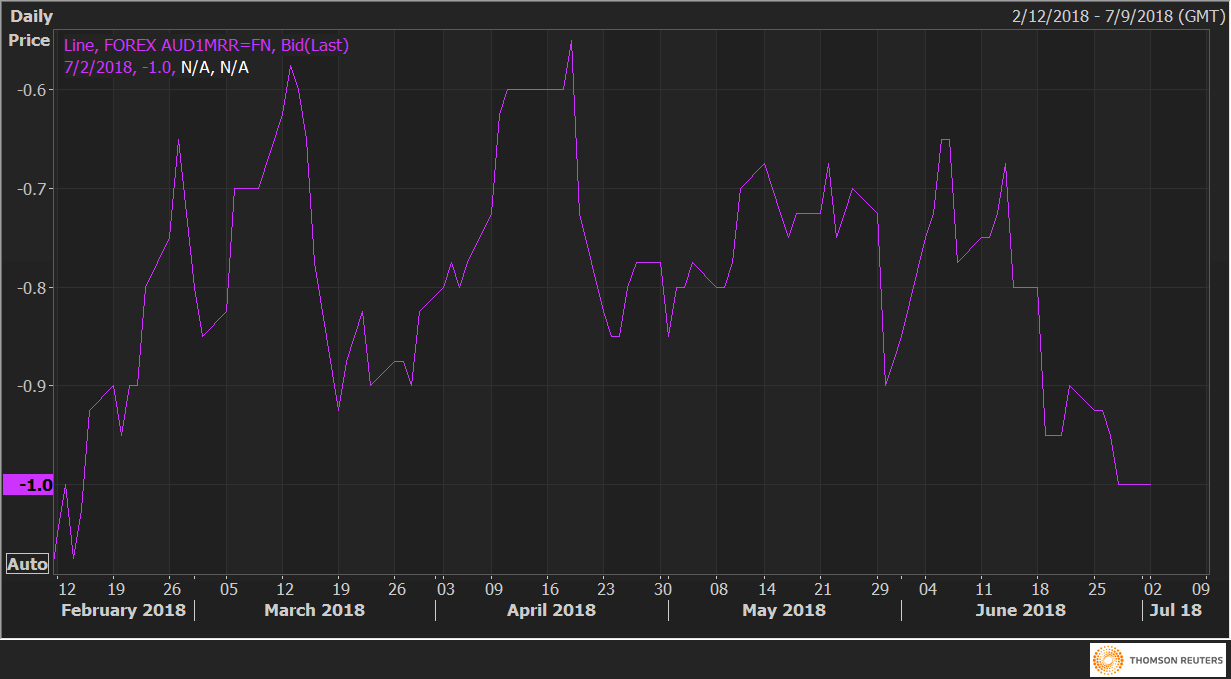
However, the risk reversals retain the bearish bias. The one-month 25 delta risk reversals (AUD1MRR) are being paid at 1.00 AUD puts since June 28 vs 0.7 AUD puts on June 14.
Clearly, the bullish technical signs have failed to weaken the demand for the AUD puts (bearish bets).
AUD/USD daily chart
-636660945285510604.png)
AUD1MRR