- GBP/USD failed to break above the 1.3200 level in Asia and has been drifting lower since the open of the markets this week.
- The momentum is bearish as GBP/USD is trading below its 200-period simple moving average and the next scaling points to the downside are seen near the 1.3100 figure and the current 2018 low at 1.3049 level.
GBP/USD 15-minute chart
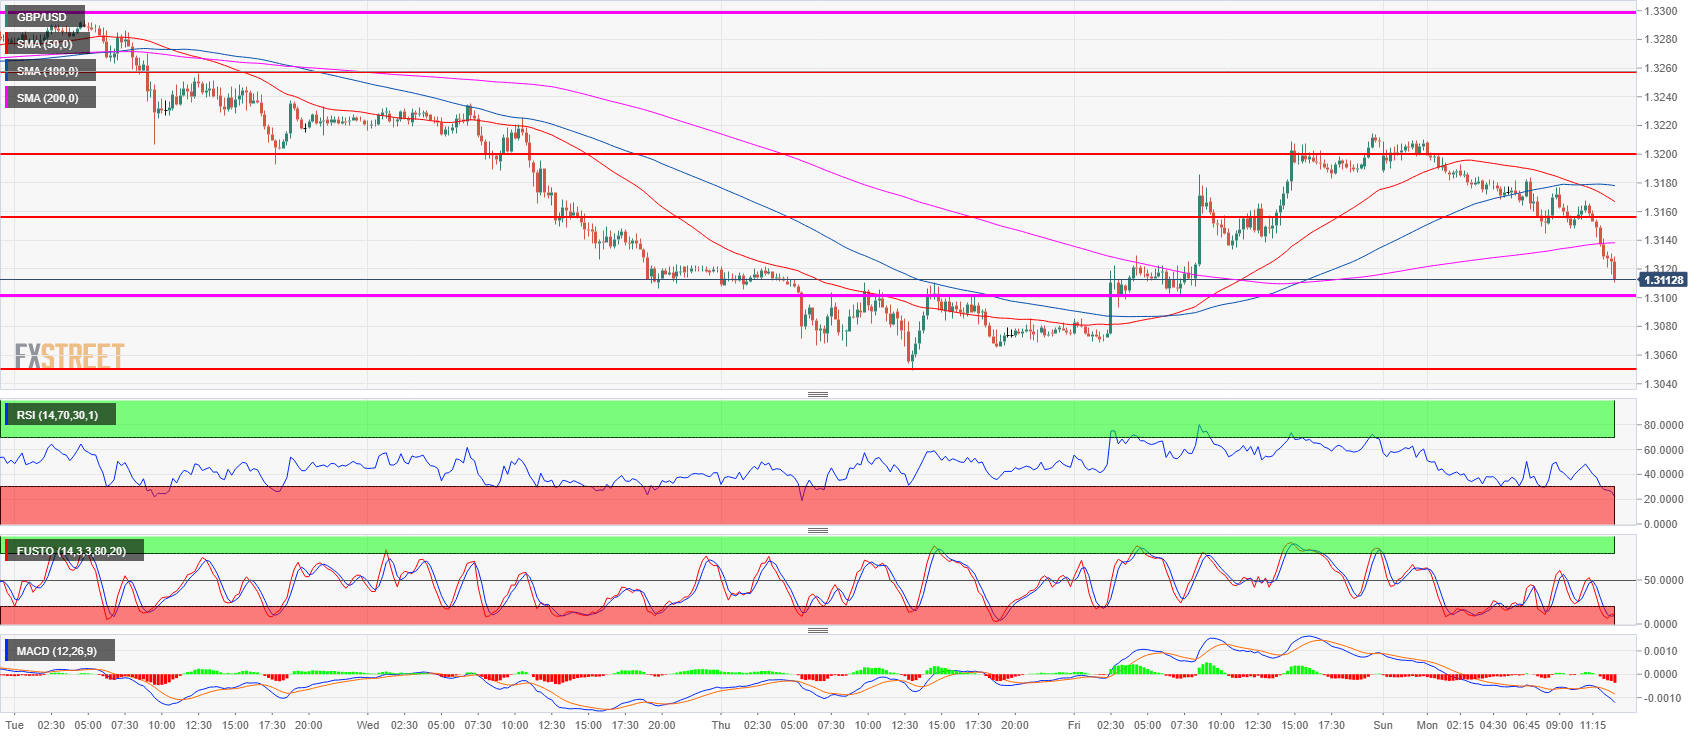
Spot rate: 1.3112
Relative change: -0.72%
High: 1.3210
Low: 1.3110
Trend: Bearish
Resistance 1: 1.3155 former breakout point
Resistance 2: 1.3200 figure
Resistance 3: 1.3256, intraday swing high lastTuesday
Resistance 4: 1.3300 figure
Support 1: 1.3100 figure
Support 2: 1.3049 current 2018 low
Support 3: 1.3027 October 6, 2017 swing low
