- GBP/USD is up almost 60 pips from the daily low at 1.3010, the current 2018 low established earlier in the day.
- GBP/USD bulls are trying to create a bullish reversal. The next scaling point to the upside is seen near the key 1.3100 figure. A breakout above the level would open the gates to 1.3155 resistance.
- However, a failure to bring the market above 1.3100 should keep GBP/USD under pressure.
GBP/USD 15-minute chart
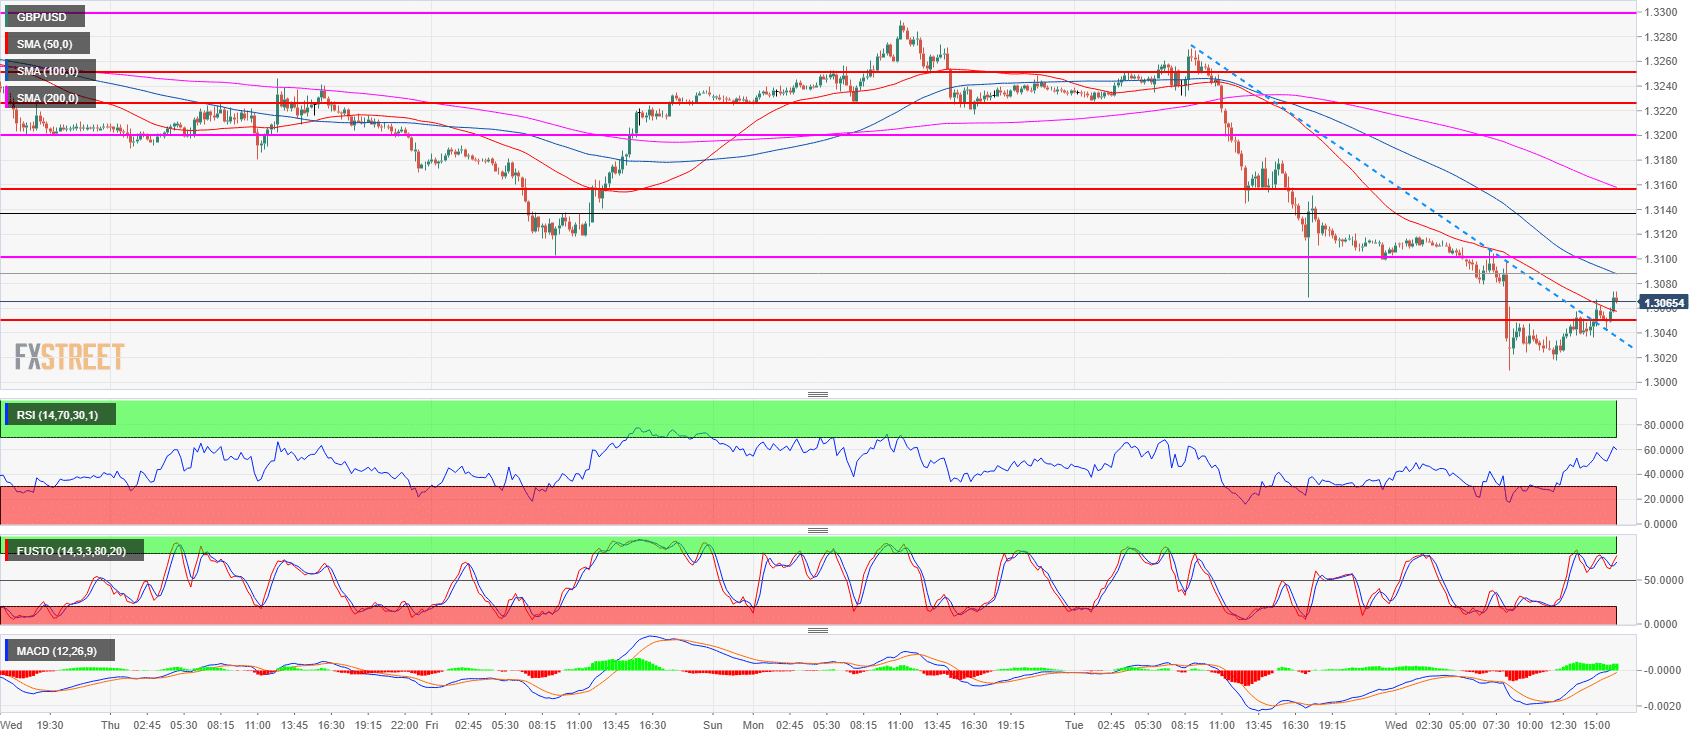
Spot rate: 1.3063
Relative change: -0.41%
High: 1.3120
Low: 1.3010
Trend: Bearish / bullish reversal attempt
Resistance 1: 1.3100 figure
Resistance 2: 1.3155 former breakout point
Resistance 3: 1.3200 figure
Resistance 4: 1.3225 intraday swing low
Resistance 5: 1.3250 June 4 high
Resistance 6: 1.3300 figure
Resistance 7: 1.3363 last week’s high
Resistance 8: 1.3400 figure
Resistance 9: 1.3472 June’s high
Support 1: 1.3049 former 2018 low
Support 2: 1.3010 current 2018 low
Support 3: 1.3027 October 6, 2017 swing low
