“¢ The commodity once again managed to bounce off the $1218 horizontal zone and was being supported by weaker USD/US Treasury bond yields.
“¢ Subsequent up-move, however, is likely to confront stiff resistance near a confluence resistance, comprising of a short-term descending trend-line and 50-hour SMA.
“¢ Technical indicators on the 1-hourly chart hold in negative territory and hence, the uptick might be seen as an opportunity to initiate fresh short positions.
Gold 1-hourly chart
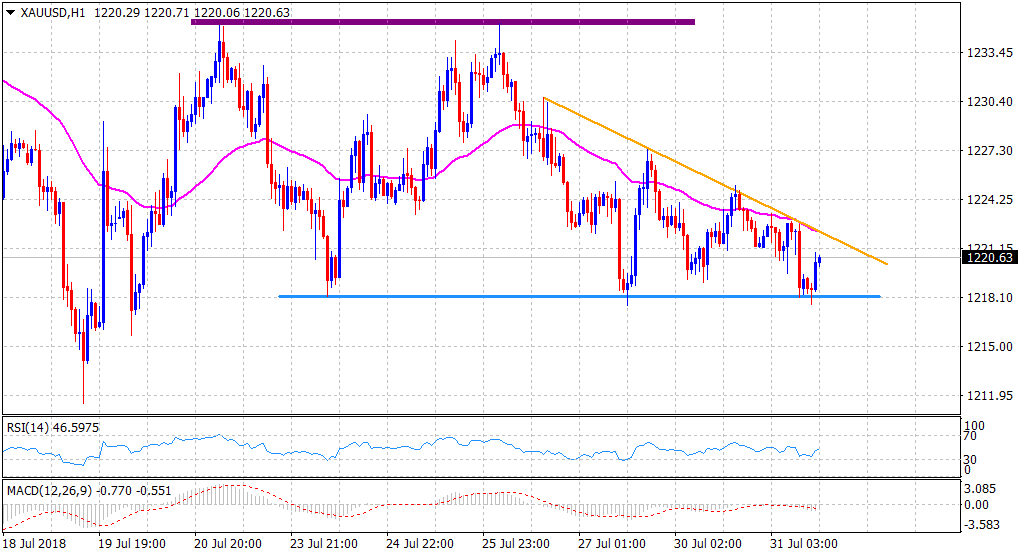
Spot rate: $1220.63
Daily Low: $1217.67
Daily High: $1223.38
Trend: Bearish
Resistance
R1: $1222 (confluence region)
R2: $1225 (overnight swing high)
R3: $1232 (horizontal zone)
Support
S1: $1217 (over one-week-old horizontal support)
S2: $1212 (YTD low set on July 19)
S3: $1205 (July 2017 swing low)
