“¢ The pair continued with its steady decline and finally broke below a confluence support, comprising of a short-term descending trend-channel support and 50-hour SMA.
“¢ Technical indicators on the 30-min chart have started drifting into bearish territory and add credence to the bearish breakdown, paving way for further downside.
“¢ Traders, however, are likely to refrain from placing aggressive bets and prefer to wait on the sidelines ahead of the latest RBA monetary policy decision, due to be announced during the Asian session on Tuesday.
AUD/USD 1-hourly chart
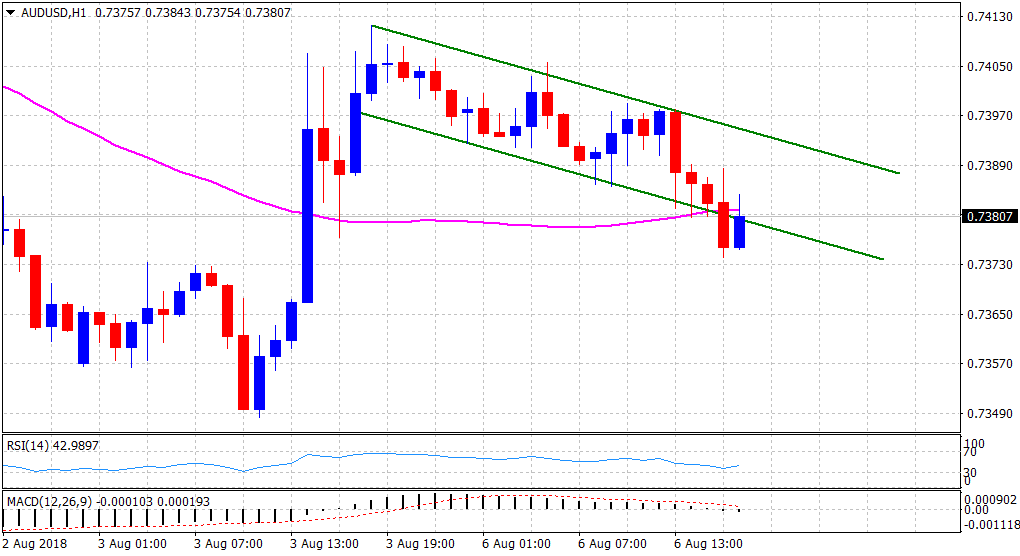
Spot Rate: 0.7382
Daily Low: 0.7374
Daily High: 0.7406
Trend: Bearish
Resistance
R1: 0.7401 (50-period SMA H4)
R2: 0.7441 (last Tuesday’s swing high)
R3: 0.7495 (R3 daily pivot-point)
Support
S1: 0.7348 (2-week low set last Friday)
S2: 0.7325 (S2 daily pivot-point)
S3: 0.7310 (YTD low set on July 2)
