- GBP/USD is starting the week with an 80-pip sell-off to 1.2920 breaking below the former 2018 low at 1.2957.
- GBP/USD bulls consider that the market fell too far too fast and are currently trying to create a pullback up. Resistances to the upside are likely located near 1.2957 the former 2018 low and 1.2987, August 3 low.
- Bears next objective is to breakout below 1.2920 to extend the bear trend towards 1.2900 figure and 1.2852 August 31, 2017.
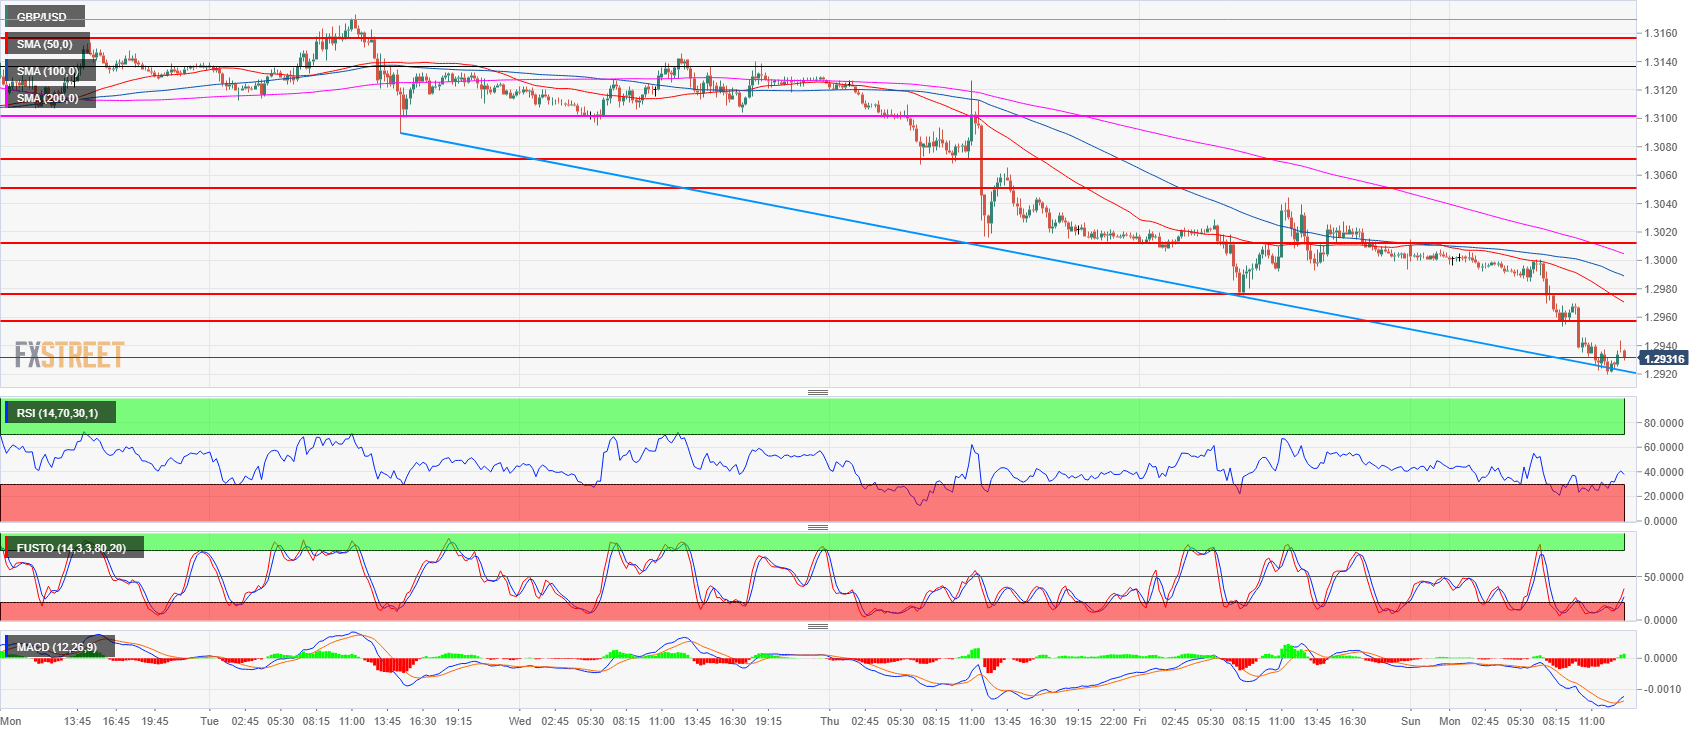
Spot rate: 1.2933
Relative change: -0.52%
High: 1.3014
Low: 1.2920
Trend: Bearish / Pullback up
Resistance 1: 1.2957 July 17 low
Resistance 2: 1.2987 August 3 low
Resistance 3: 1.3000-1.3010 area, figure and July 18 low
Resistance 4: 1.3049 June 28 low
Resistance 5: 1.3100-1.3076 area, figure and July 24 low
Resistance 6: 1.3155 former breakout point
Resistance 7: 1.3200 figure
Resistance 8: 1.3230 supply level
Resistance 9: 1.3250 June 4 high
Support 1: 1.2920 -1.2900 area, current 2018 low and figure
Support 2: 1.2852 August 31, 2017
Support 3: 1.2800 figure
