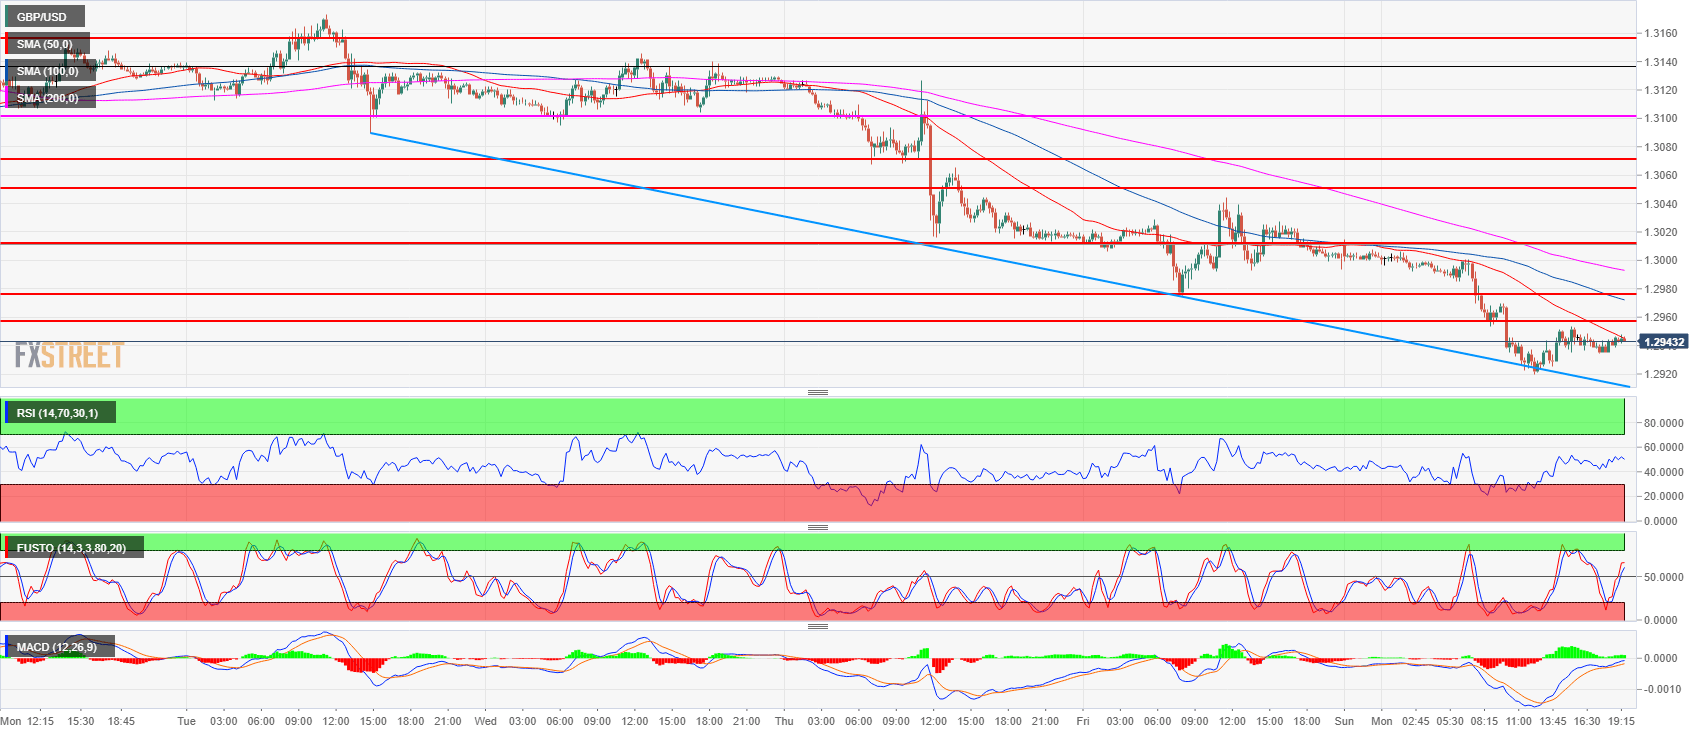
- GBP/USD is having a shallow pullback up after the losses seen earlier in the session. GBP/USD has reached a new 2018 low and is currently trading just below the 50-period simple moving average and 1.2957, the July 17 low.
- Bears objective is to keep GBP/USD below the 1.2957 and 1.2987 (Friday’s swing low) resistances in order to keep the bear trend intact. On the other hand, bulls want the trade above 1.2987 in order to create a bullish reversal.
- As the main trend is bearish and there is no sign of a bottom, GBP/USD should react to the downside near and below 1.2957-1.2987 area. If bulls push through the zone a deeper pullback might be in the making.
GBP/USD daily chart
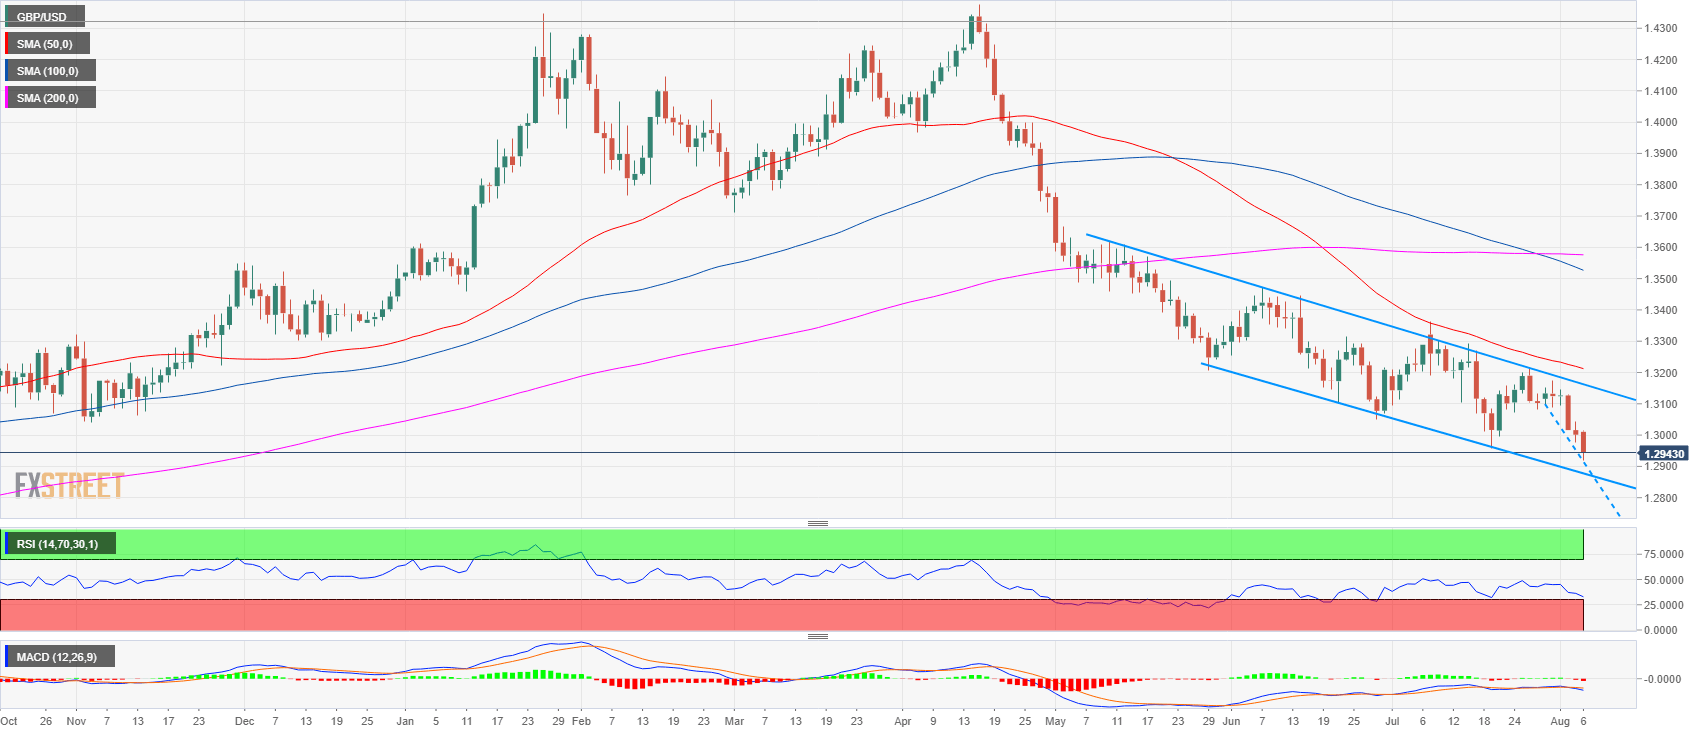
Spot rate: 1.2943
Relative change: -0.45%
High: 1.3014
Low: 1.2920
Trend: Bearish
Resistance 1: 1.2957 July 17 low
Resistance 2: 1.2987 August 3 low
Resistance 3: 1.3000-1.3010 area, figure and July 18 low
Resistance 4: 1.3049 June 28 low
Resistance 5: 1.3100-1.3076 area, figure and July 24 low
Resistance 6: 1.3155 former breakout point
Resistance 7: 1.3200 figure
Resistance 8: 1.3230 supply level
Resistance 9: 1.3250 June 4 high
Support 1: 1.2920 -1.2900 area, current 2018 low and figure
Support 2: 1.2852 August 31, 2017 low
Support 3: 1.2800 figure
