- USD/CHF dropped to the 0.9930 level in the early European session and then bulls lifted USD/CHF almost to the 0.9960 resistance level.
- USD/CHF bulls want to breakout above the 0.9989-1.0000 strong resistance area while bears want to create a reversal down by driving the pair below 0.9920 August 3 low.
- In the absence of a break above 0.9989-1.0000 area, USD/CHF is likely going to trade sideways to down in the near future. The short-term resistance is currently the 0.9960 level.
-636692605730309555.png)
USD/CHF daily chart
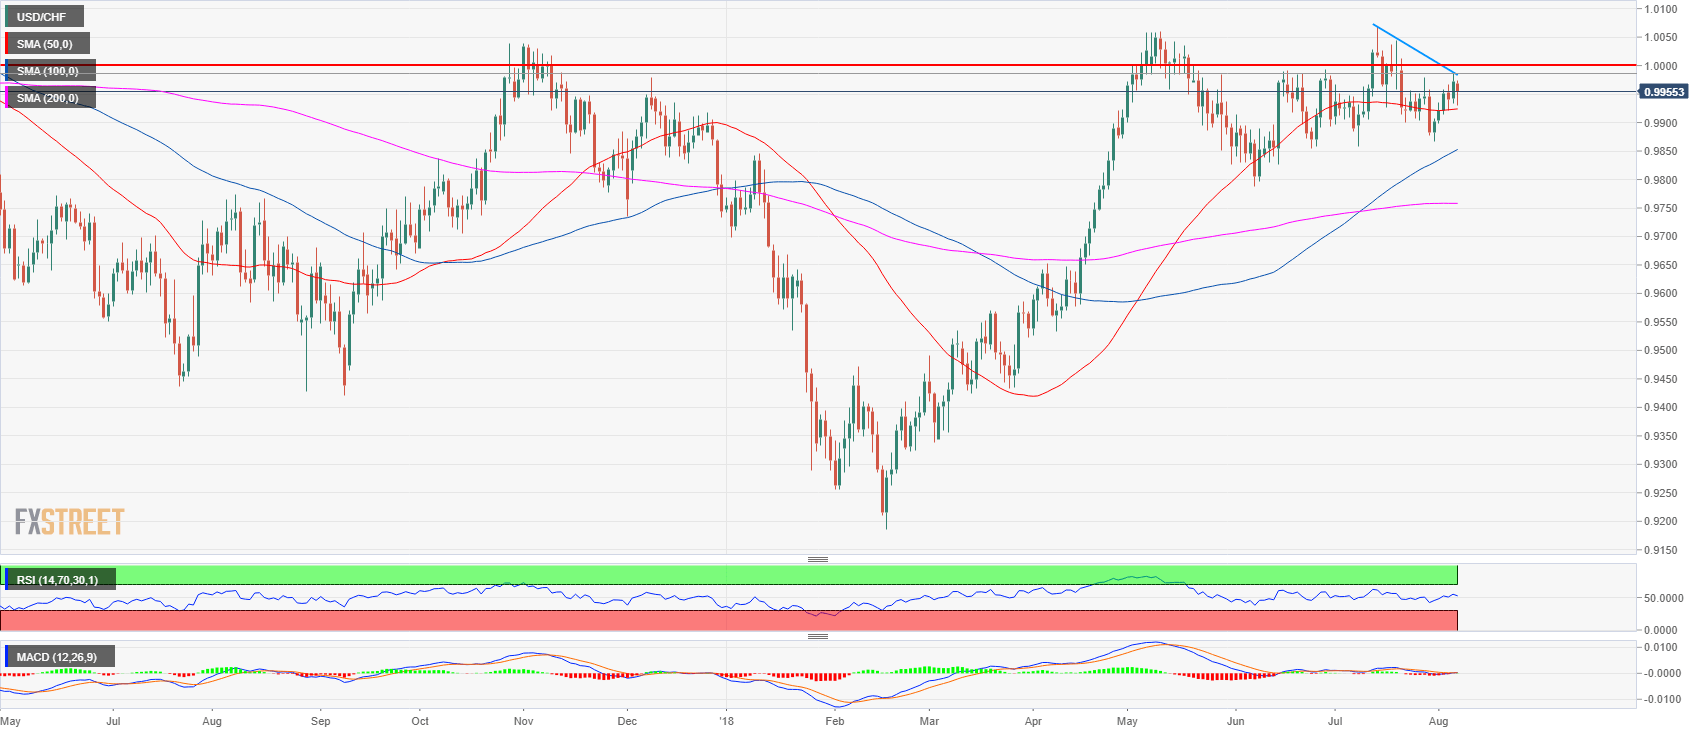
Spot rate: 0.9955
Relative change: -0.17%
High: 0.9974
Low: 0.9930
Trend: Bullish / Bearish below 0.9920
Resistance 1: 0.9960-0.9970 area, supply level and July 27 high
Resistance 2: 0.9989-1.0000 area, June 15 high and parity
Resistance 3: 1.0043-1.0069 area, July 19 high and current 2018 high
Resistance 4: 1.0170 March 7, 2017 high
Resistance 5: 1.0343 December 15, 2016
Support 1: 0.9950 figure
Support 2: 0.9920 August 3 low
Support 3: 0.9900 figure
Support 4: 0.9867 July 31 low
Support 5: 0.9856 June 25 low
Support 6: 0.9788 June 7 swing low
