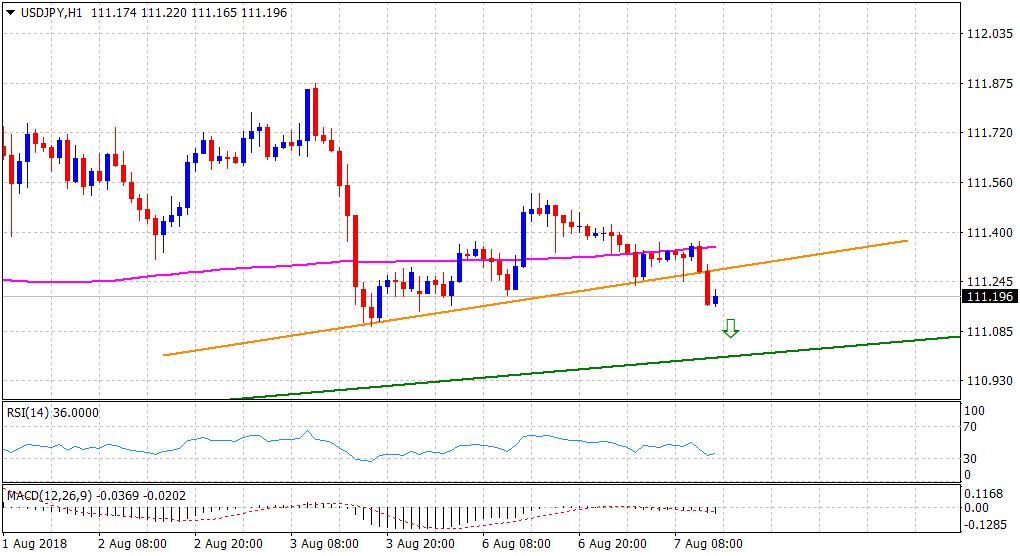
“¢ The pair remained capped at the 200-hour SMA for a major part of today’s trading session and has now broken below a short-term ascending trend-line support on the 1-hourly chart.
“¢ The downfall now seems to get extended towards testing another ascending trend-line support, extending from late-May through lows touched in June and July.
“¢ A follow-through selling would mark a fresh bearish breakdown and pave the way for an extension of the pair’s near-term downward trajectory.
USD/JPY 1-hourly chart
Spot Rate: 111.20
Daily High: 111.43
Trend: Bearish
Resistance
R1: 111.43 (current day swing high)
R2: 111.76 (R2 daily pivot-point)
R3: 112.00 (round figure mark)
Support
S1: 110.95 (ascending trend-line support)
S2: 110.79 (S3 daily pivot-point)
S3: 110.59 (last week’s swing low)
