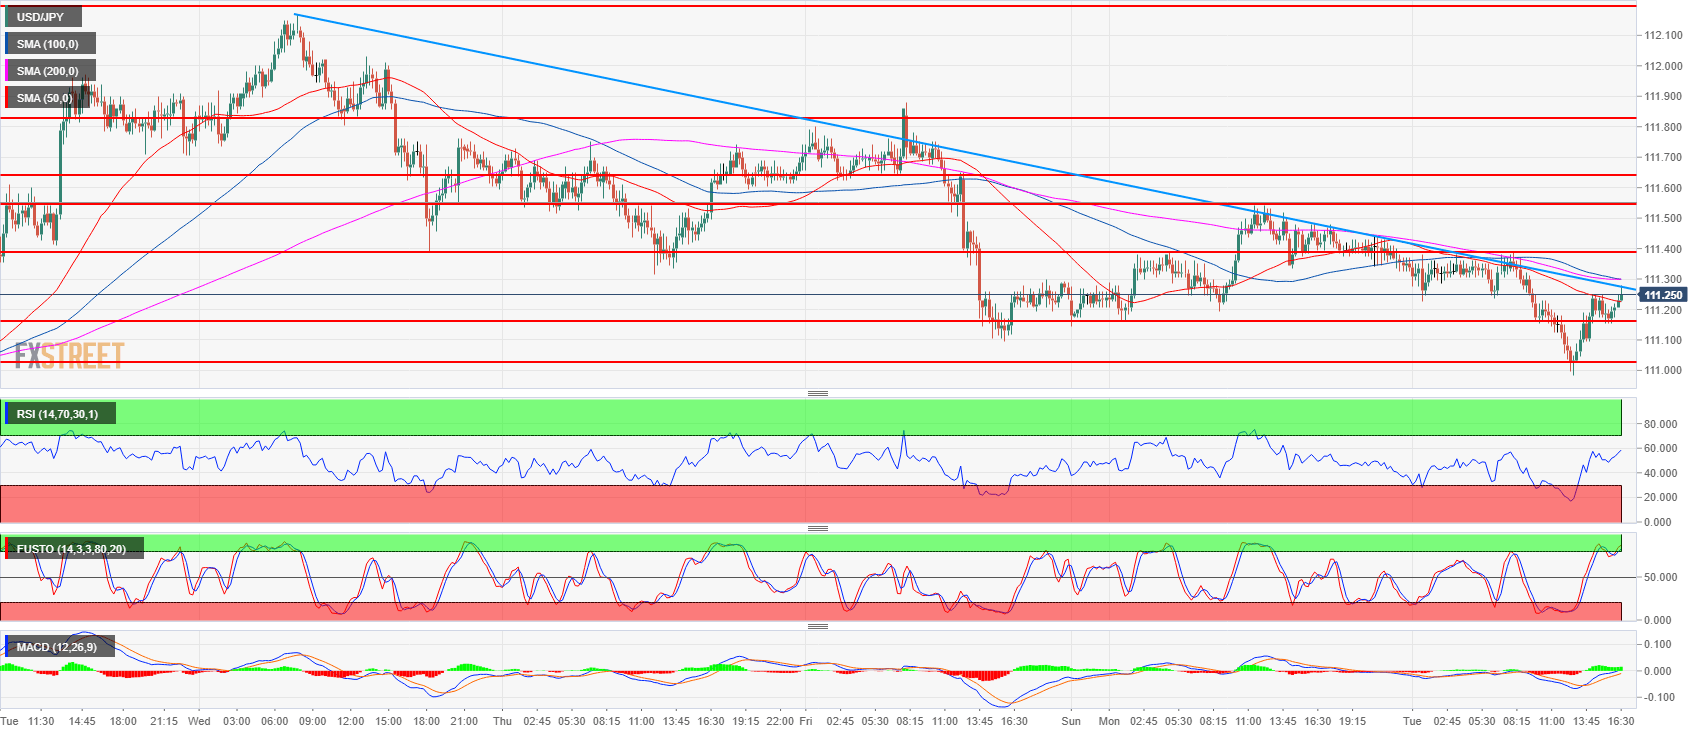
- USD/JPY lost about 40 pips in early European trading to find support at the 111.00 figure.
- USD/JPY is currently challenging the 50-period simple moving average and the bearish trendline.
- A bull breakout would likely target the 111.54-111.64 area and 111.82-112.00 area. Near-term supports are seen near the 111.02-111.16 area and 111.00 level.
USD/JPY daily chart
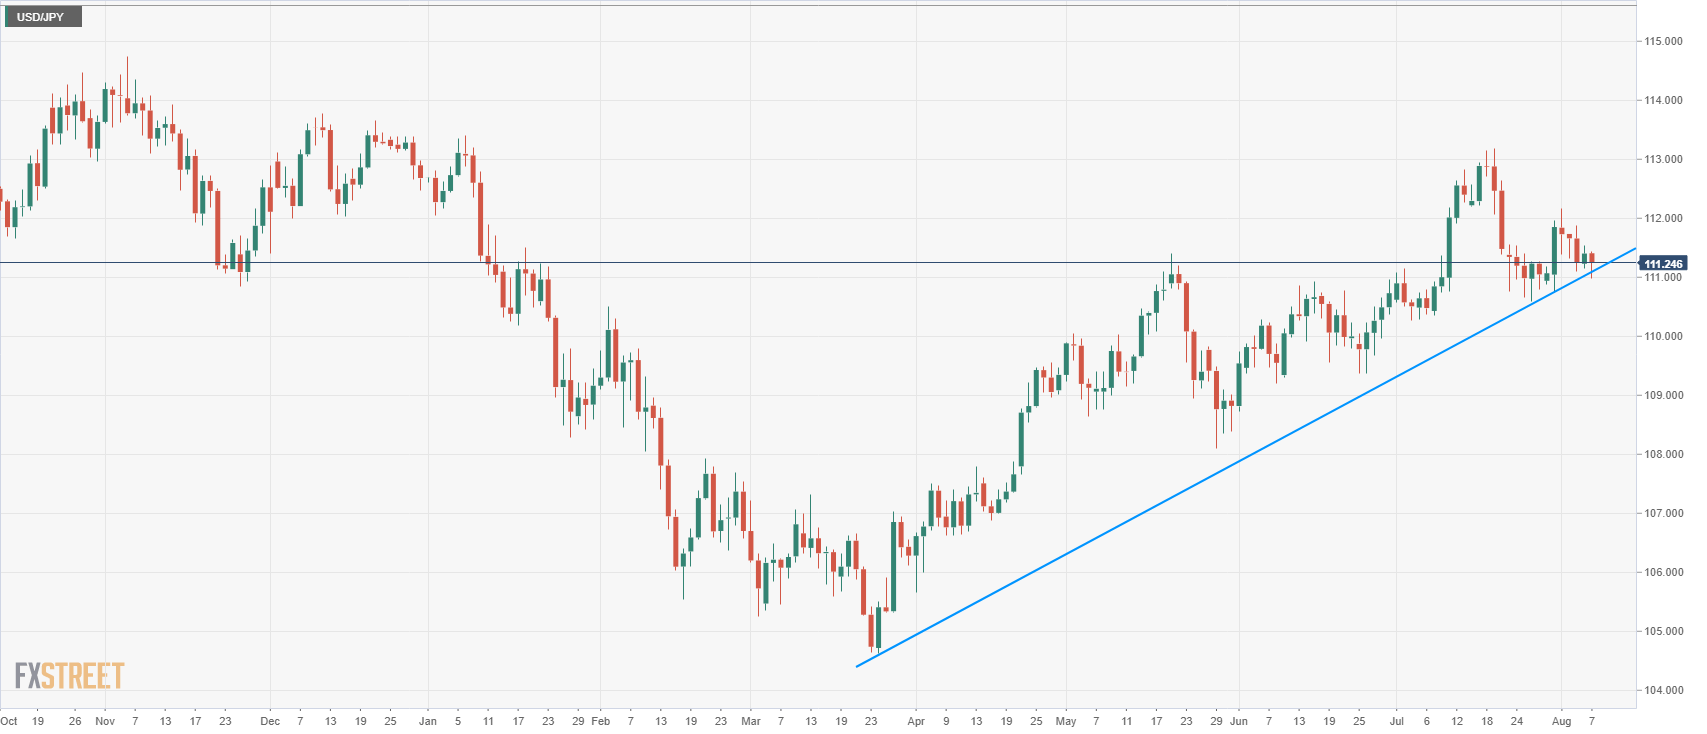
Spot rate: 111.25
Relative change: -0.15%
High: 111.44
Low: 110.98
Trend: Bullish
Resistance 1: 111.39 May 21 swing high
Resistance 2: 111.54-111.64 area, August 6, high and supply/demand level
Resistance 3: 111.82-112.00 area, supply level and figure
Resistance 4: 112.19-112.40 area, July 11 high and intraday swing low
Resistance 5: 112.64 July 12 high
Resistance 6: 113.18, 2018 high
Resistance 7: 113.26-113.38, 200-weekly simple moving average and January 8 high
Resistance 8: 114.45 October 27, 2017 high
Support 1: 111.02-111.16 area, figure and current August 6 low
Support 2: 110.90 June 15 swing high
Support 3: 110.75, July 23 low
Support 4: 110.58 July 26 swing low
Support 5: 110.27 July 4 low
