“¢ The pair’s recent rise over the past one week or so once again stalled near a short-term descending trend-line hurdle, also coinciding with 55-day SMA.
“¢ The pair remains within an eight-week-old broader trading range and diverging technical indicators on the daily/4-hourly chart also fail to support any firm directional bias.
“¢ Hence, it would be prudent to wait for a convincing break in either direction before traders start positioning for the pair’s near-term trajectory.
AUD/USD 4-hourly chart
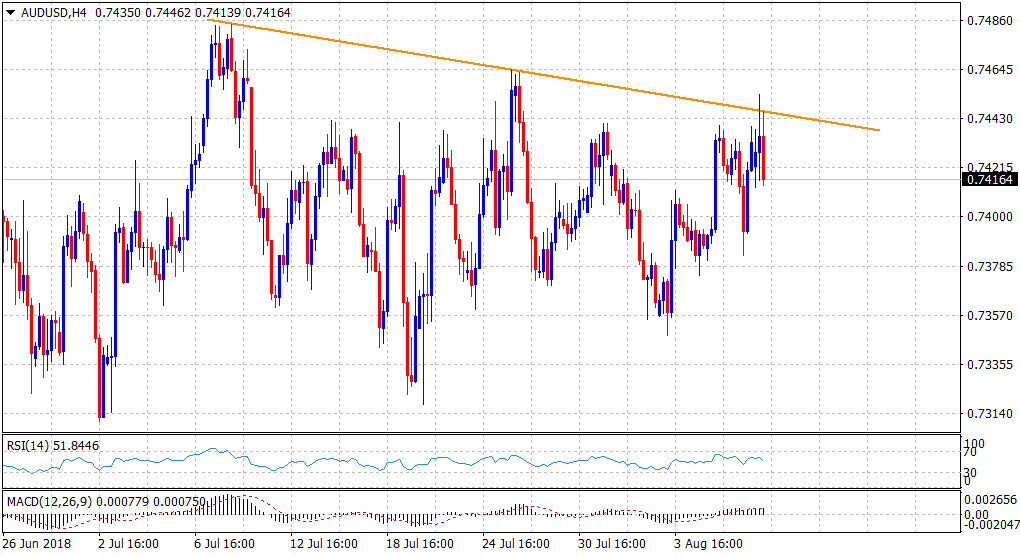
Spot Rate: 0.7416
Daily High: 0.7453
Trend: Range-bound
Resistance
R1: 0.7450 (55-day SMA)
R2: 0.7484 (July 9/10 swing high)
R3: 0.7500 (psychological round figure)
Support
S1: 0.7400 (round figure mark)
S2: 0.7383 (overnight swing low)
S3: 0.7359 (S2 daily pivot-point)
