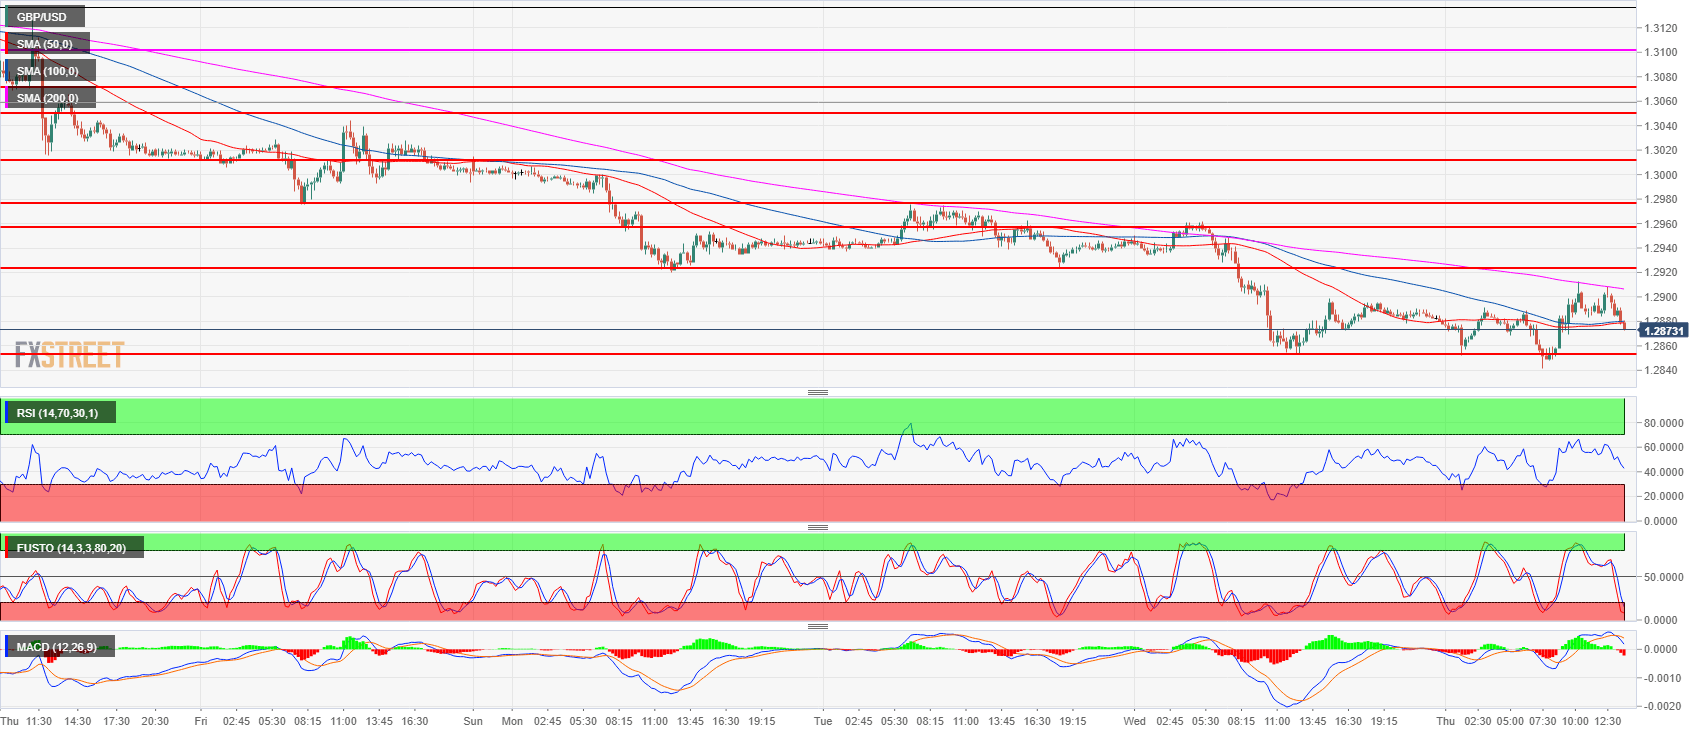
- GBP/USD reached a new 2018 low (at 1.2841), yet again. However, bulls were quick to step in and drive the market near the 1.2900 figure. GBP/USD found resistance at the 200-period simple moving average (SMA) and GBP/USD is resuming the bear trend.
- The next targets to the downside are likely located near the current 2018 low. A bear breakout below the level would likely lead to an acceleration near 1.2774 August 24, 2017 low.
- On the flip side, as the market is quite oversold bulls will try to prevent any sell-off to go very far as their objective is to breakout above 1.2900-1.2923 area in order to reach 1.2957 July 17 low.
GBP/USD daily chart
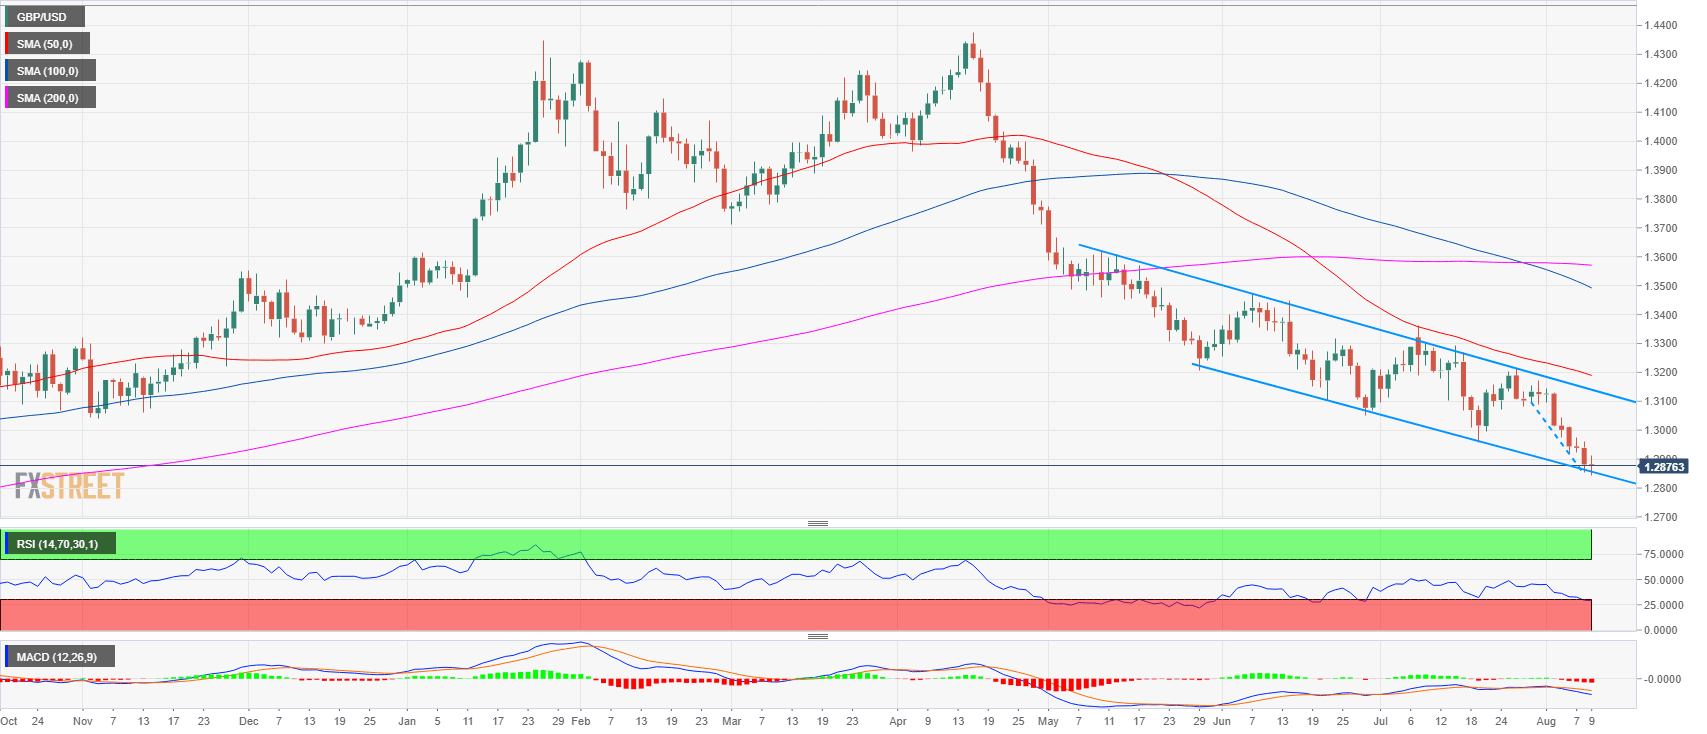
Spot rate: 1.2878
Relative change: -0.47%
High: 1.2961
Low: 1.2853
Trend: Bearish / Bullish pullback above 1.2900-1.2923 area
Resistance 1: 1.2900-1.2923 area, figure and August 7 low
Resistance 2: 1.2957 July 17 low
Resistance 3: 1.2975 August 3 low
Resistance 4: 1.3000-1.3010 area, figure and July 18 low
Resistance 5: 1.3049 June 28 low
Resistance 6: 1.3100-1.3076 area, figure and July 24 low
Resistance 7: 1.3155 former breakout point
Resistance 8: 1.3200 figure
Resistance 9: 1.3230 supply level
Resistance 10: 1.3250 June 4 high
Support 1: 1.2841 August 9, low (2018 low)
Support 2: 1.2774 August 24, 2017 low
Support 3: 1.2700 figure
