- The S&P500 finished the day with a slide as the index made virtually a repeat of Wednesday’s trading.The S&P500 is losing steam as it is approaching the all-time-high at 2,875.50. Bulls objective is to push through 2,875.50 level in order to breakout into uncharted territory towards 2,900 figure.
- On the flip side, bears want to breakout below 2,852.00 (this Thursday low) in order to create a reversal down and target 2,845.00 and 2,835.25 August 6 low.
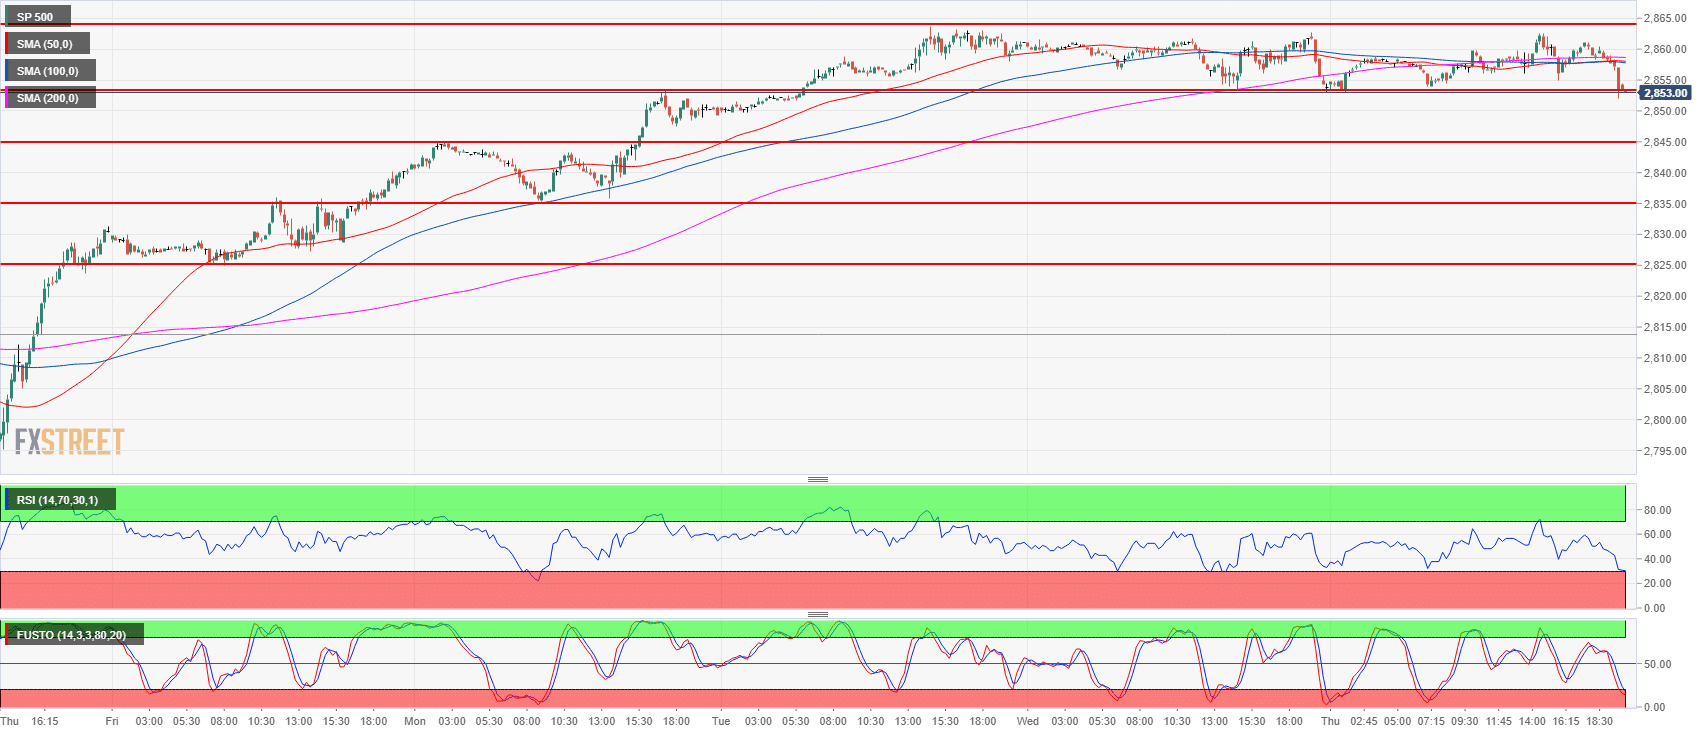
- As the S&P500 is losing momentum below its all-time-high and the 200-period simple moving average (15-m) the bears have a fair chance in having a successful bearish reversal.
S&P 500 15-minute chart
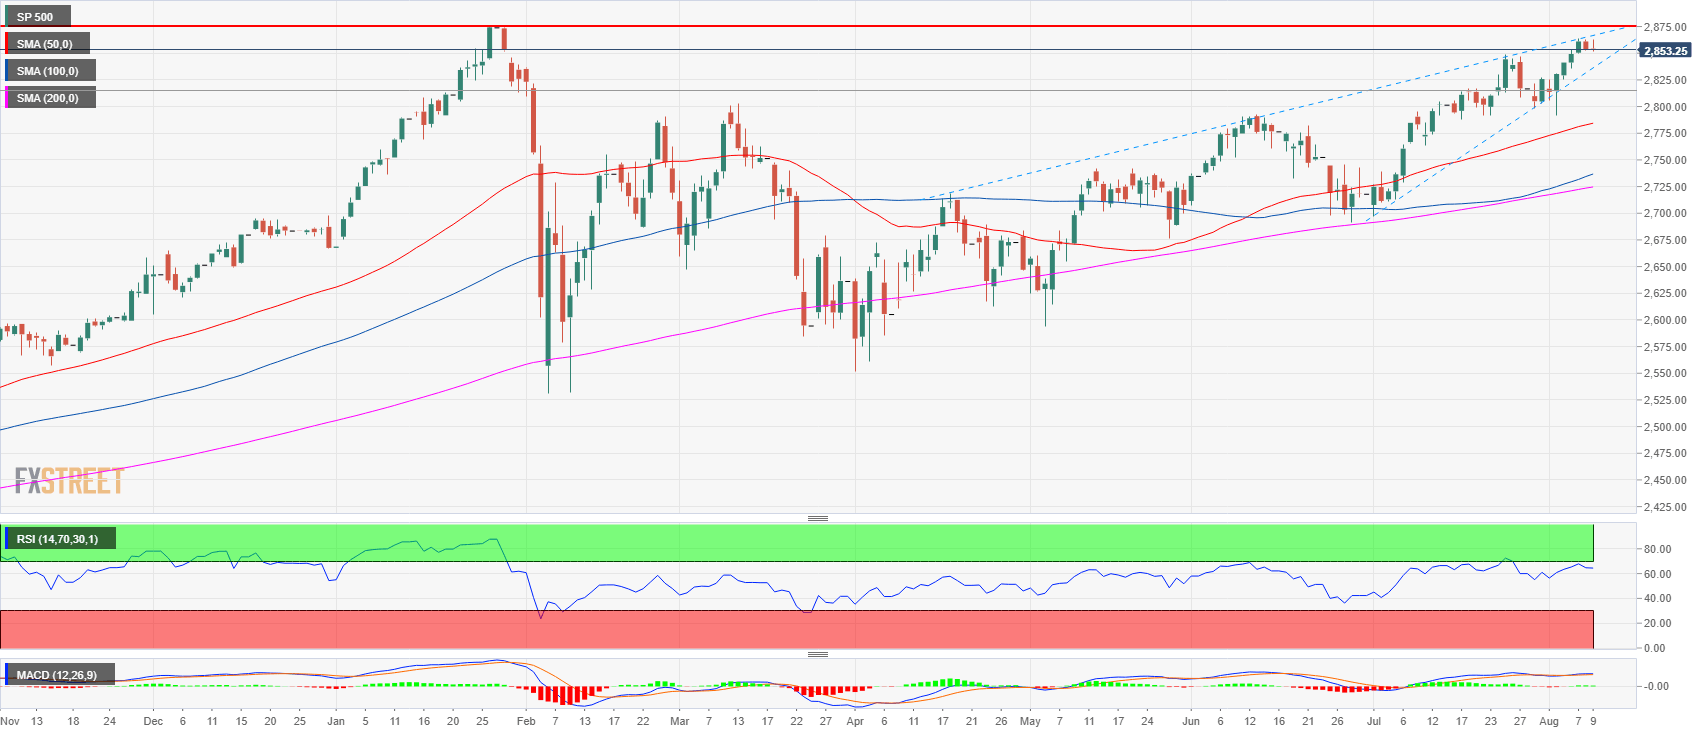
S&P 500 daily chart
Spot rate: 2,851.4
Relative change: 0.01%
High: 2,862.50
Low: 2,852.00
Trend: Bullish / Bearish reversal attempt below 2,852.00
Resistance 1: 2,863.75 August 7 high
Resistance 2: 2,875.50 all-time-high
Resistance 3: 2,900 figure
Support 1: 2,853.00 August 9 low
Support 2: 2,845.00 supply/demand level
Support 3: 2,835.25 August 6 low
Support 4: 2,825.00 August 3 low
