- USD/JPY tested the 110.16 level in the European session but found resistance. USD/JPY fell to 110.90 support and is currently trying to stabilize here. USD/JPY is also testing the 50-daily simple moving average at 110.89.
- Bears objective is to drive the currency pair below the 110.58 July 26 swing low while bulls want a resumption of the bull trend; they should ideally retake 111.45 August 8 high.
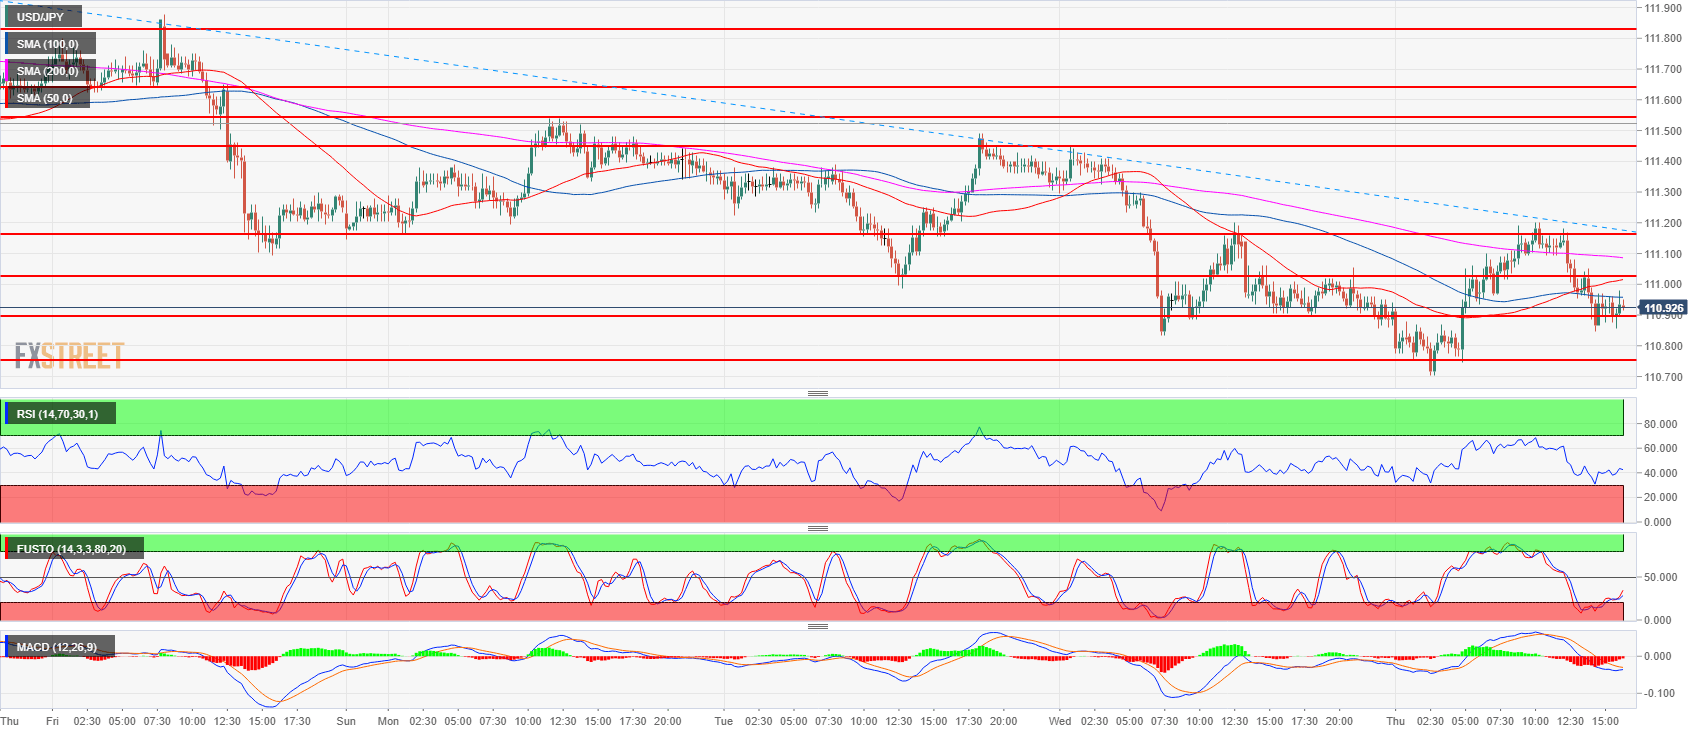
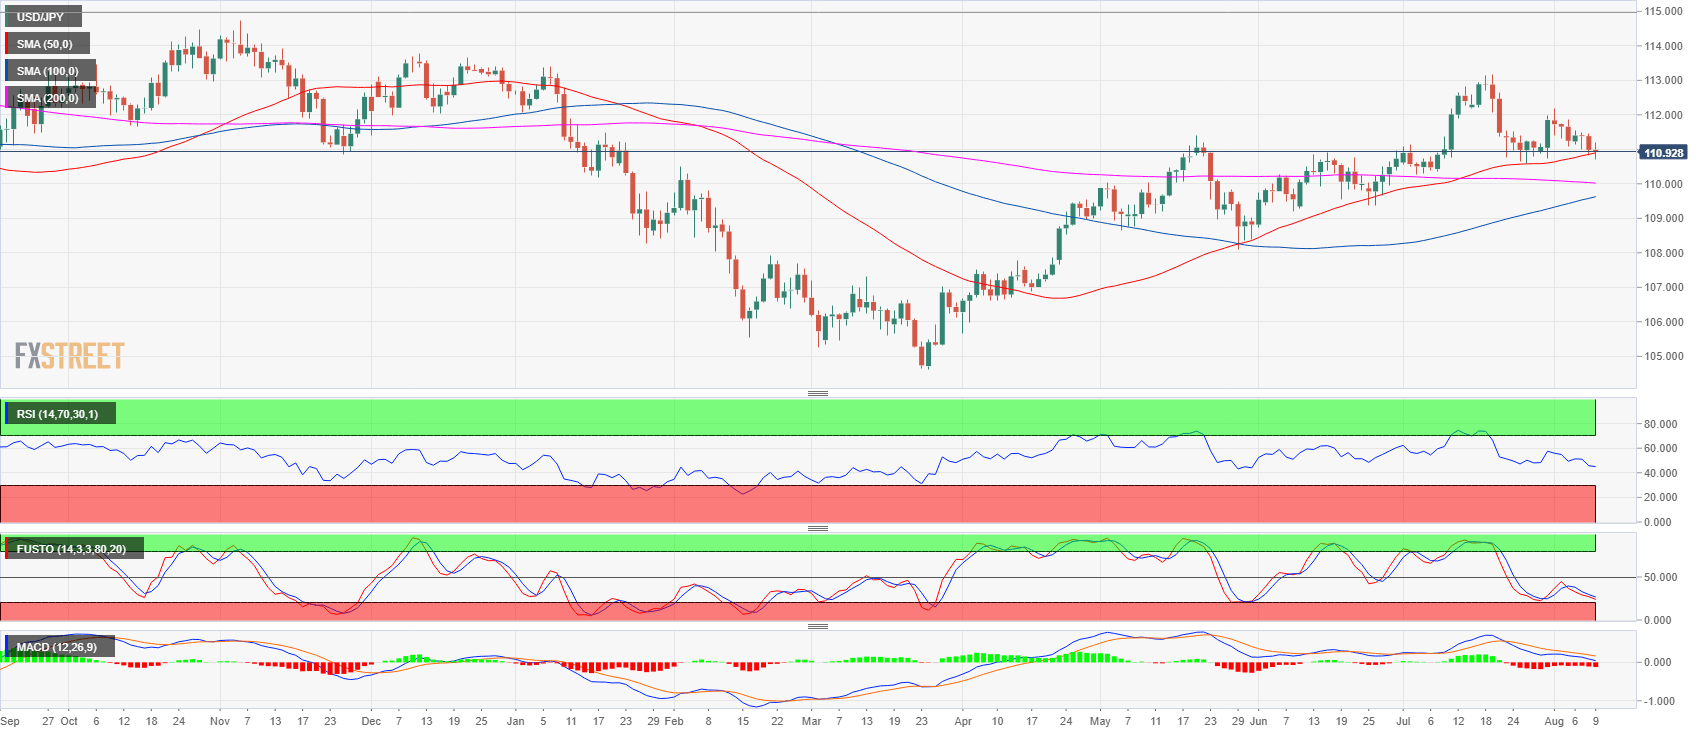
USD/JPY daily chart
Spot rate: 110.92
Relative change: -0.06%
High: 111.20
Low: 110.70
Trend: Bullish / Bearish pullback above 110.58 July 26 swing low
Resistance 1: 111.02-111.16 area, figure and current August 6 low
Resistance 2: 111.45 August 8 high
Resistance 3: 111.54-111.64 area, August 6, high and supply/demand level
Resistance 4: 111.82-112.00 area, supply level and figure
Resistance 5: 112.19-112.40 area, July 11 high and intraday swing low
Resistance 6: 112.64 July 12 high
Resistance 7: 113.18, 2018 high
Resistance 8: 113.26-113.38, 200-weekly simple moving average and January 8 high
Resistance 9: 114.45 October 27, 2017 high
Support 1: 110.90 June 15 swing high
Support 2: 110.75, July 23 low
Support 3: 110.58 July 26 swing low
Support 4: 110.27 July 4 low
