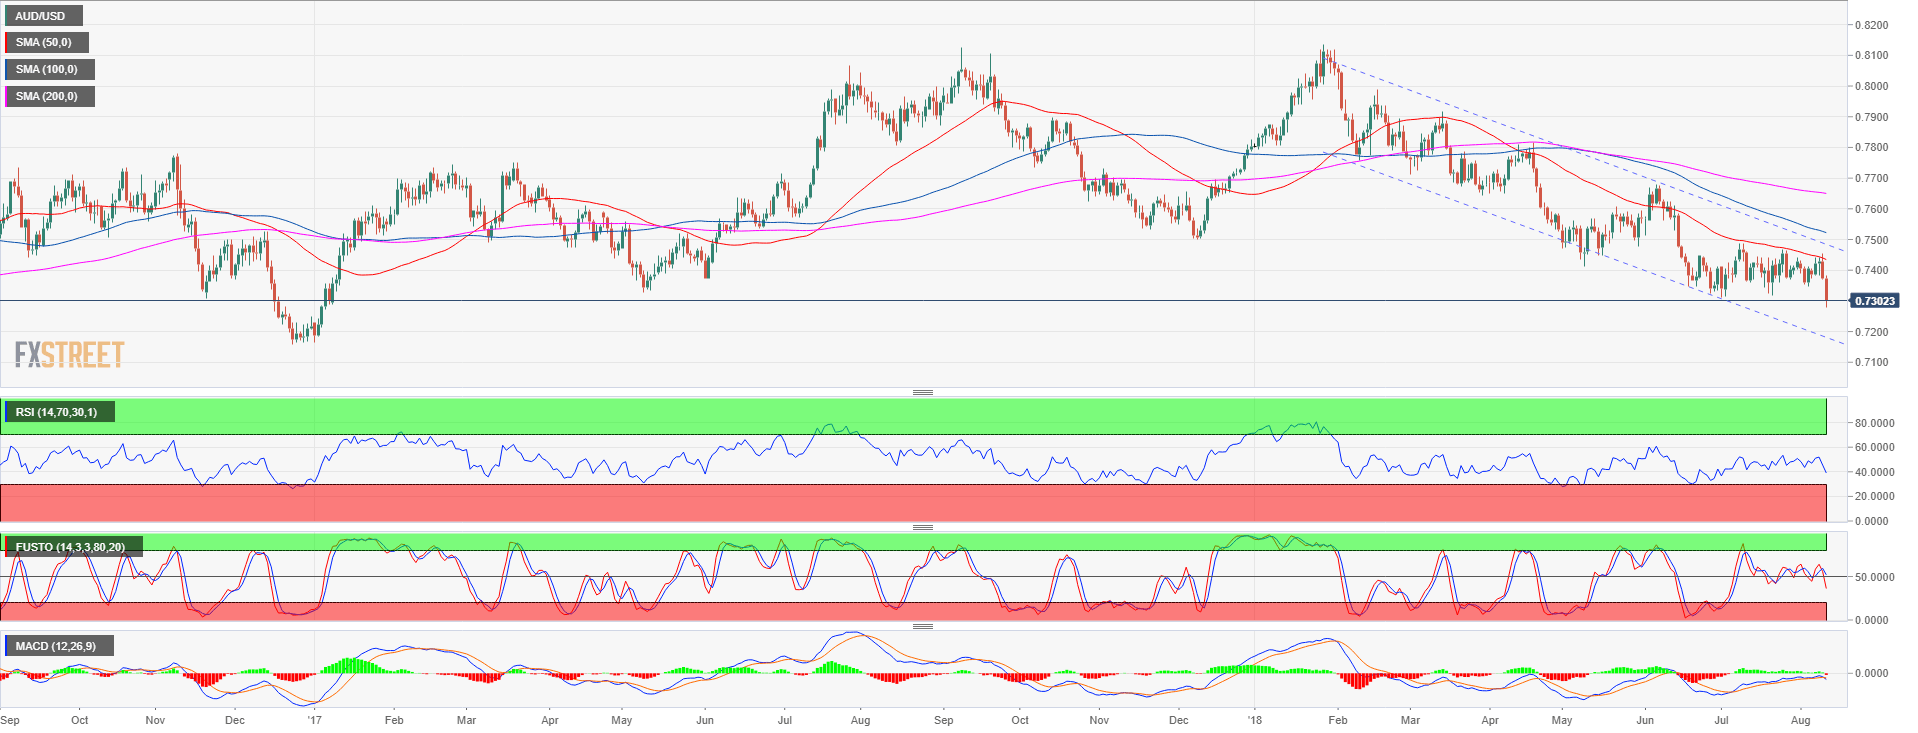
- AUD/USD finally broke to the downside from the 7-weeks trading range. AUD/USD is now extending the bear trend below the 0.7300 figure.
- AUD/USD bears next targets are likely located near 0.7246 December 30, 2016 high and the 0.7200 figure.
- Resistances become 0.7310 July 2 low and 0.7345 demand level.
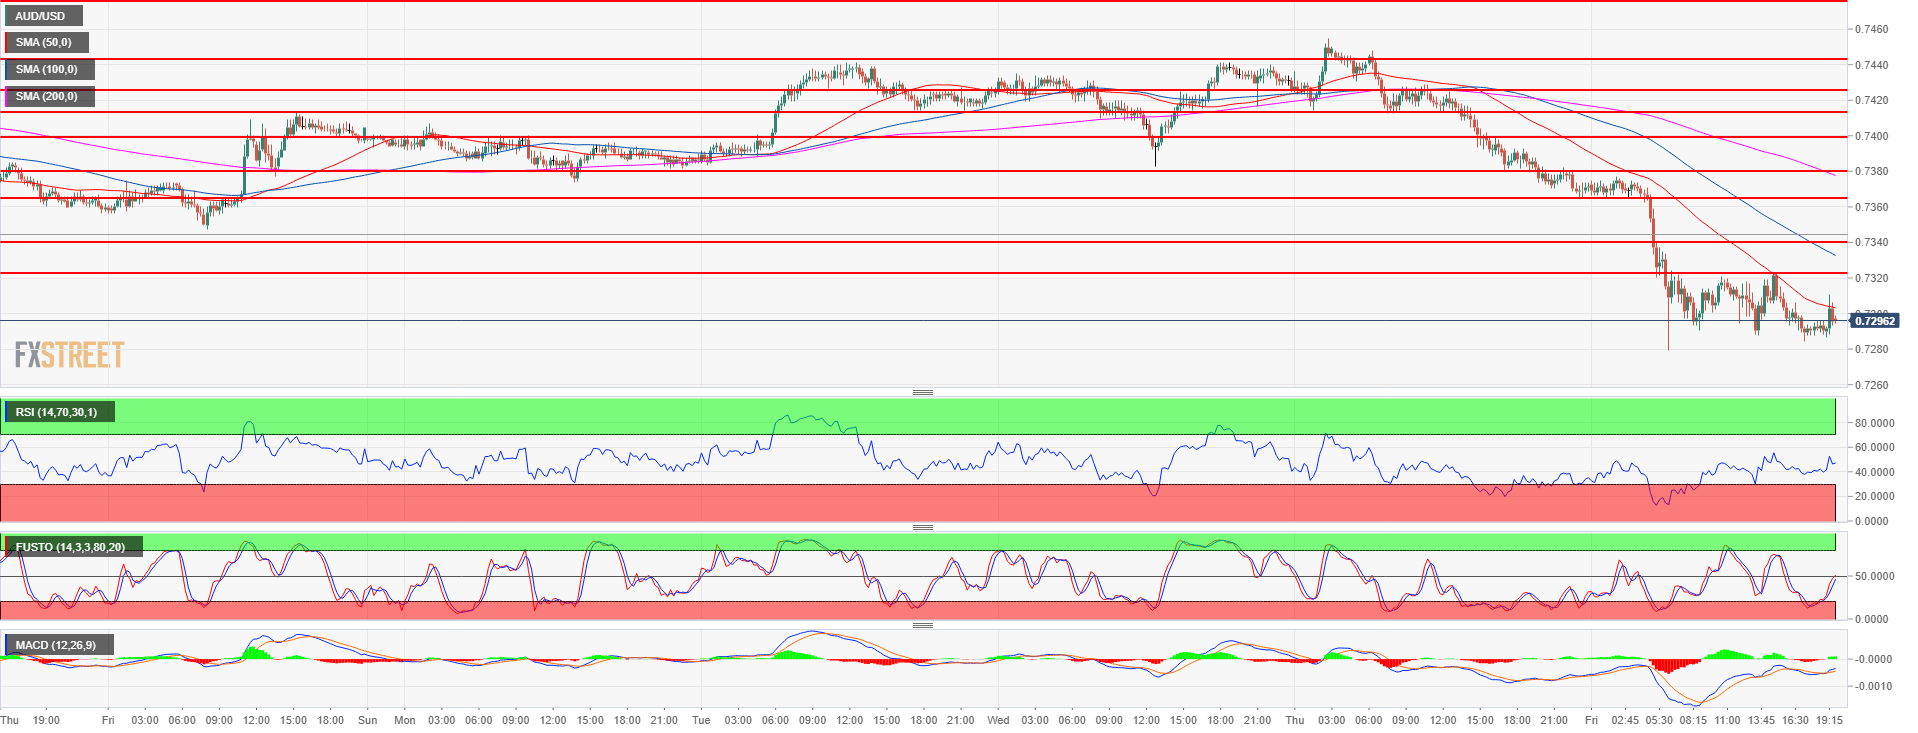
AUD/USD 15-minute chart
AUD/USD daily chart
Spot rate: 0.7296
Relative change: -1.03%
High: 0.7383
Low: 0.7279
Trend: Bearish
Resistance 1: 0.7310 July 2 low
Resistance 2: 0.7345 demand level
Resistance 3: 0.7364 June 28 high
Resistance 4: 0.7380 June 26 low
Resistance 5: 0.7400 figure
Resistance 6: 0.7413 current August 3 high
Resistance 7: 0.7442 July 31 high
Resistance 8: 0.7463 July 26 high
Resistance 9: 0.7500 figure
Resistance 10: 0.7600 figure
Resistance 11: 0.7674 swing high
Support 1: 0.7246 December 30, 2016 high
Support 2: 0.7200 figure
Support 3: 0.7159 December 26, 2016 low
