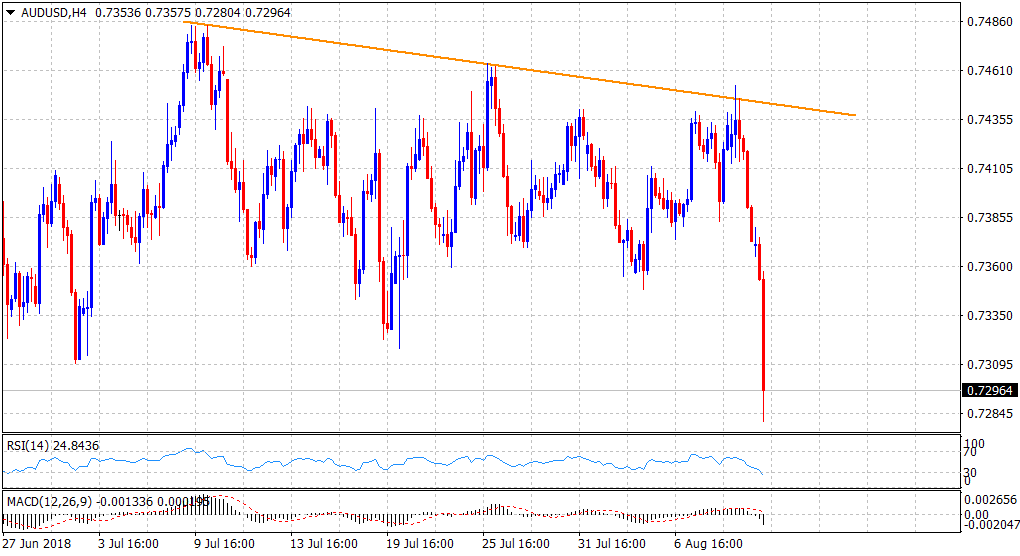
“¢ The pair extended overnight rejection slide from a one-month-old descending trend-line hurdle, also coinciding with 55-day SMA and tumbled to 20-month lows.
“¢ Weakness below the 0.7300 handle now seems to have confirmed a bearish breakdown below an eight-week-old broader trading range.
“¢ Technical indicators on daily charts are still far from near-term oversold conditions and thus, increase the pair’s vulnerability to continue with its downward trajectory.
AUD/USD 4-hourly chart
Spot Rate:
Daily High: 0.7380
Trend: Bearish
Resistance
R1: 0.7310 (previous YTD low set on July 2)
R2: 0.7355 (horizontal zone)
R3: 0.7380 (daily swing high)
Support
S1: 0.7280 (horizontal zone)
S2: 0.7259 (S3 daily pivot-point)
S3: 0.7200 (round figure mark)
