“¢ The precious metal extended overnight rejection slide from 200-hour SMA and dropped to test the lower end of its weekly trading range in the last hour.
“¢ A strong follow-through USD buying interest was seen as one of the key factors exerting some fresh selling pressure around the dollar-denominated commodity.
“¢ A convincing break through the rectangular chart pattern formation should open room for the resumption of the commodity’s well-established bearish trend.
“¢ Technical indicators on the 1-hourly chart have started drifting into oversold territory and might be the only factor to help limit deeper losses ahead of today’s US CPI figures.
Gold 1-hourly chart
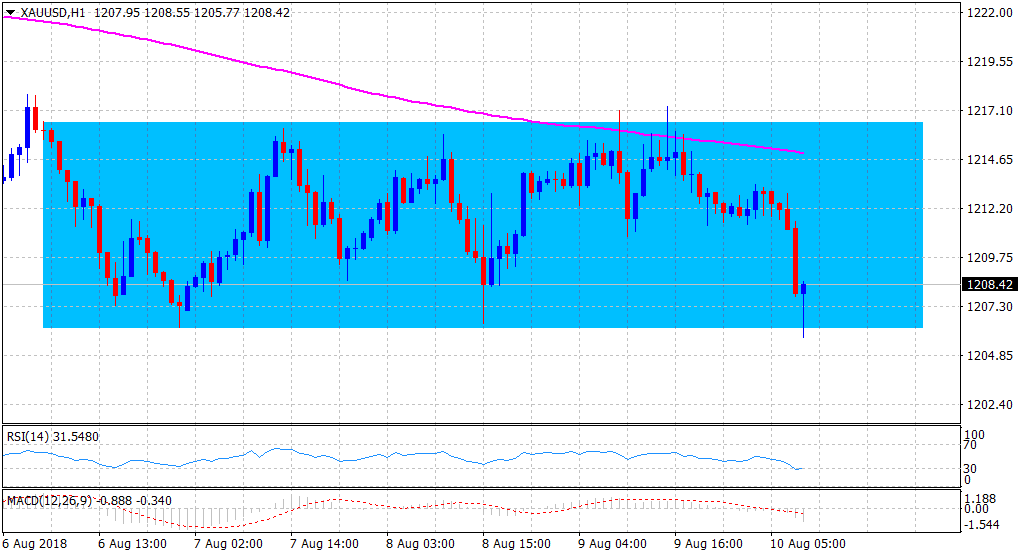
Spot Rate: $1208.42
Daily High: $1213.38
Daily Low: $1205.77
Trend: Range-bound
Resistance
R1: $1213 (current day swing high)
R2: $1217 (weekly high set on Monday)
R3: $1228 (July 31 swing high)
Support
S1: $1205 (17-month low set last Friday)
S2: $1200 (psychological round figure mark)
S3: $1195 (March 2017 swing low)
