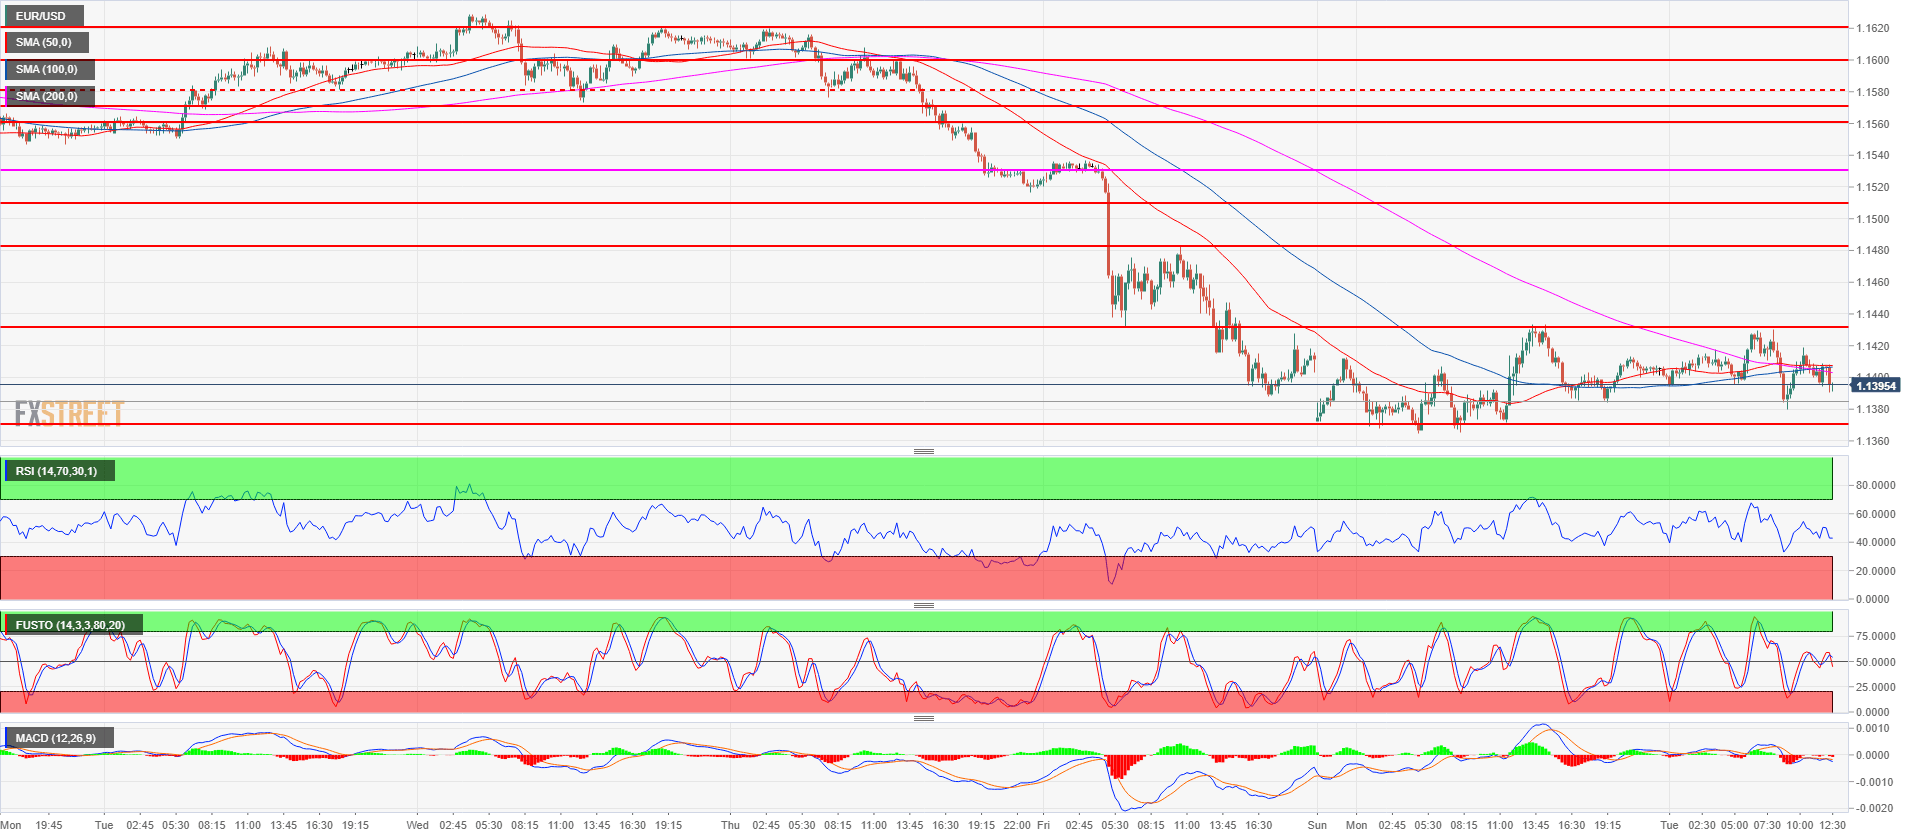
- EUR/USD has found resistance below the 1.1432 resistance and at the 50, 100 and 200-period simple moving average on the 15-minute chart suggesting that the correction might soon be coming to an end.
- Bears next objective is to reconquer to 2018 low at 1.1365 in order to drive the market towards 1.1300 figure and 1.1178 June 27, 2017 low.
- The main resistance is seen at 1.1432 and 1.1483 intraday swing high (August 10). A breakout above 1.1432 would invalidate the bearish scenario in the short-term.
EUR/USD 15-minute chart
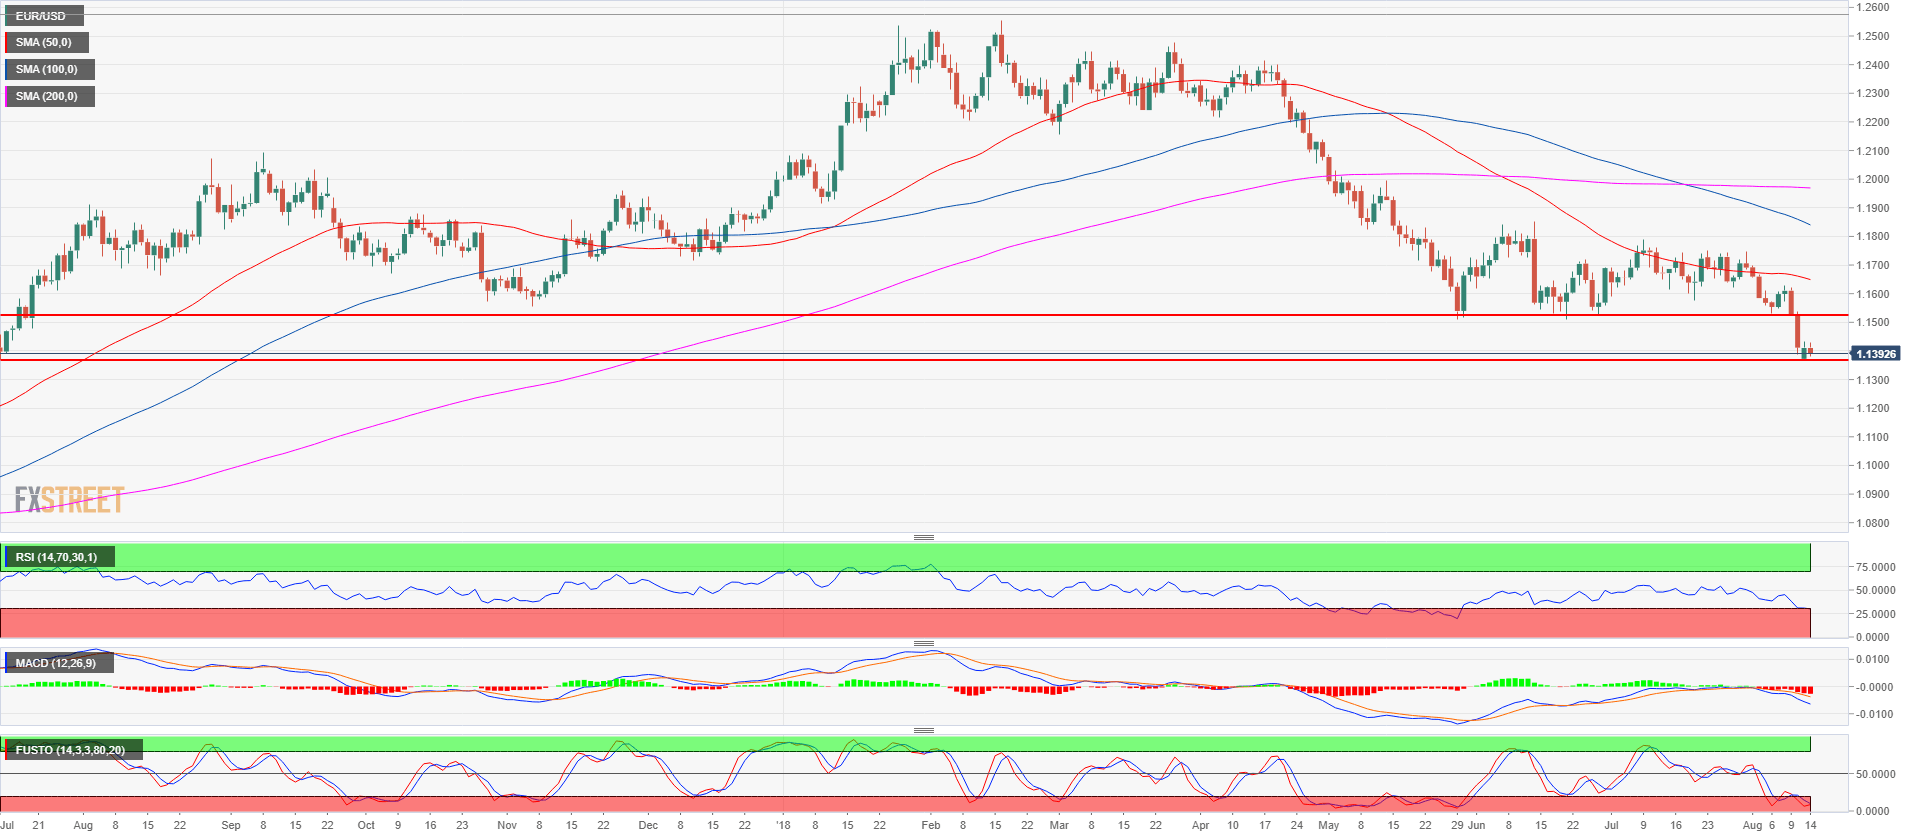
EUR/USD daily chart
Spot rate: 1.1396
Relative change: -0.13%
High: 1.1430
Low: 1.1379
Trend: Bearish
Resistance 1 1.1432 supply/demand level
Resistance 2: 1.1483 intraday swing high (August 10)
Resistance 3: 1.1508 June 8 low
Resistance 4: 1.1527 June 28 low
Resistance 5: 1.1571-1.1581 area, August 6 high and August 2 low
Resistance 6: 1.1600-1.1620 area, figure and July 27 low
Resistance 7: 1.1640-1.1649 area, key level and July 12 low
Resistance 8: 1.1672 June 27 high
Resistance 9: 1.1700 figure
Resistance 10: 1.1750 supply level
Resistance 11: 1.1760-1.1795 supply levels
Resistance 12: 1.1851-1.1854 area, June high and 38.2% Fibonacci retracement from mid-April-May bear move
Support 1: 1.1365-1.1370, 2018 low and July 13, 2017 low
Support 2: 1.1300 figure
Support 3: 1.1178 June 27, 2017 low
