“¢ The pair continued with its consolidative trading action with a broader range, forming a rectangular chart pattern on the 1-hourly chart.
“¢ The fact that the pair has been finding decent support near the 100-hour SMA support increase prospects for any further near-term recovery move.
“¢ Meanwhile, technical indicators on the mentioned chart are holding in neutral territory and thus, fail to support any firm directional bias.
“¢ Hence, it would be prudent to wait for a sustained break through the consolidative trading range before positioning for near-term direction.
AUD/USD 1-hourly chart
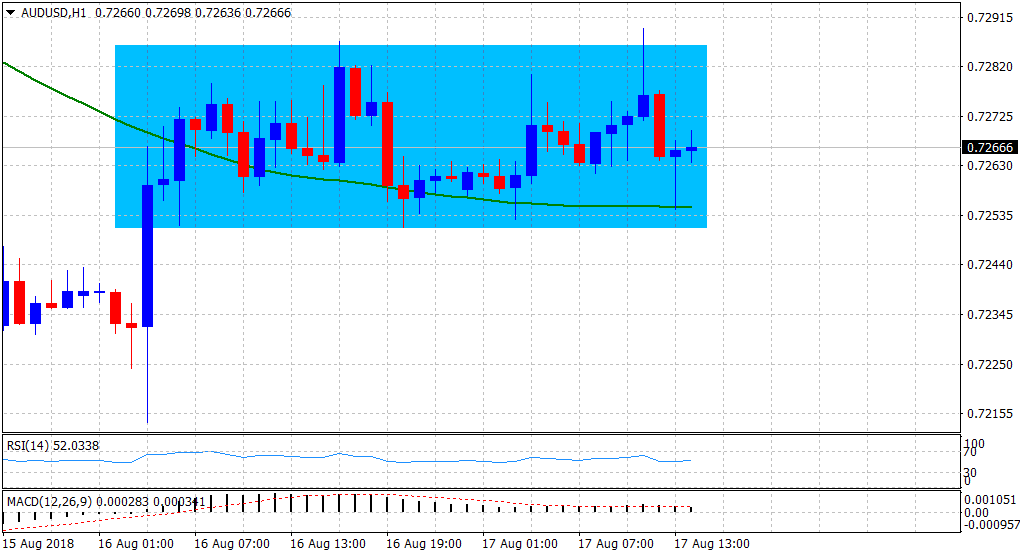
Spot Rate: 0.7267
Daily High: 0.7289
Daily Low: 0.7253
Trend: Sideways
Resistance
R1: 0.7300 (weekly high set on Monday)
R2: 0.7328 (R2 daily pivot-point)
R3: 0.7358 (100-period SMA H4)
Support
S1: 0.7221 (S1 daily pivot-point)
S2: 0.7202 (near 20-month low set on Wednesday)
S3: 0.7185 (2017 yearly low)
