“¢ The pair lacked any firm directional bias and seesawed between tepid gains/minor losses on the first trading day of a new week.
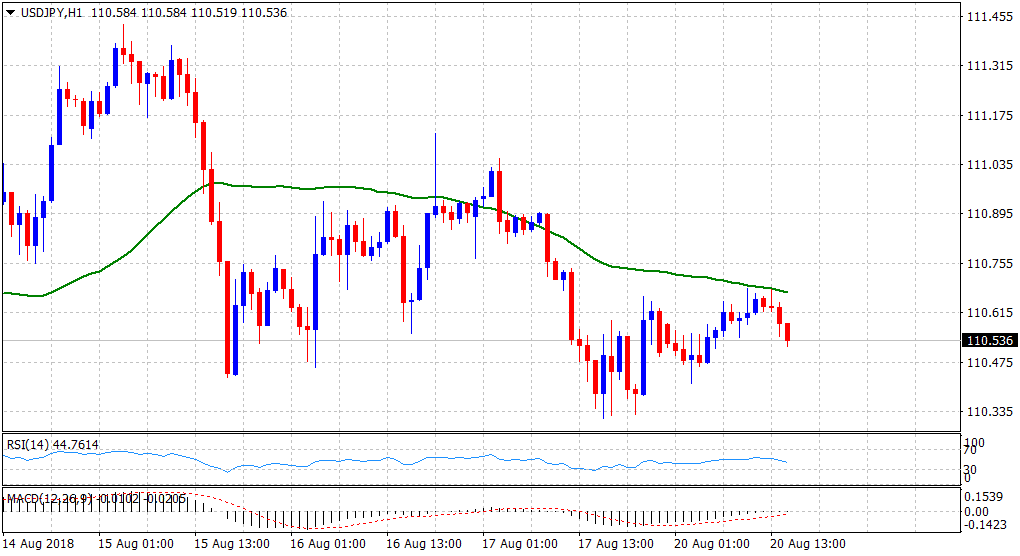
“¢ Intraday uptick remained capped at 50-hour SMA and technical indicators on the 1-hourly chart have also started drifting into negative territory.
“¢ Hence, the pair seems more likely to head back towards retesting 100-day EMA, which has been acting as a key support over the past one week or so.
“¢ A convincing break below the mentioned support would pave the way for an extension of the pair’s near-term downward trajectory.
“¢ Alternatively, a sustained move beyond 50-hour SMA might trigger a short-covering bounce back towards testing 50-day SMA immediate hurdle.
USD/JPY 1-hourly chart
Spot Rate:
Daily High: 110.68
Daily Low: 110.41
Trend: Sideways
Resistance
R1: 110.68 (current day swing high)
R2: 111.00 (50-day SMA)
R3: 111.39 (R2 daily pivot-point)
Support
S1: 110.34 (100-day EMA)
S2: 110.00 (psychological round figure mark)
S3: 109.86 (S2 daily pivot-point)
