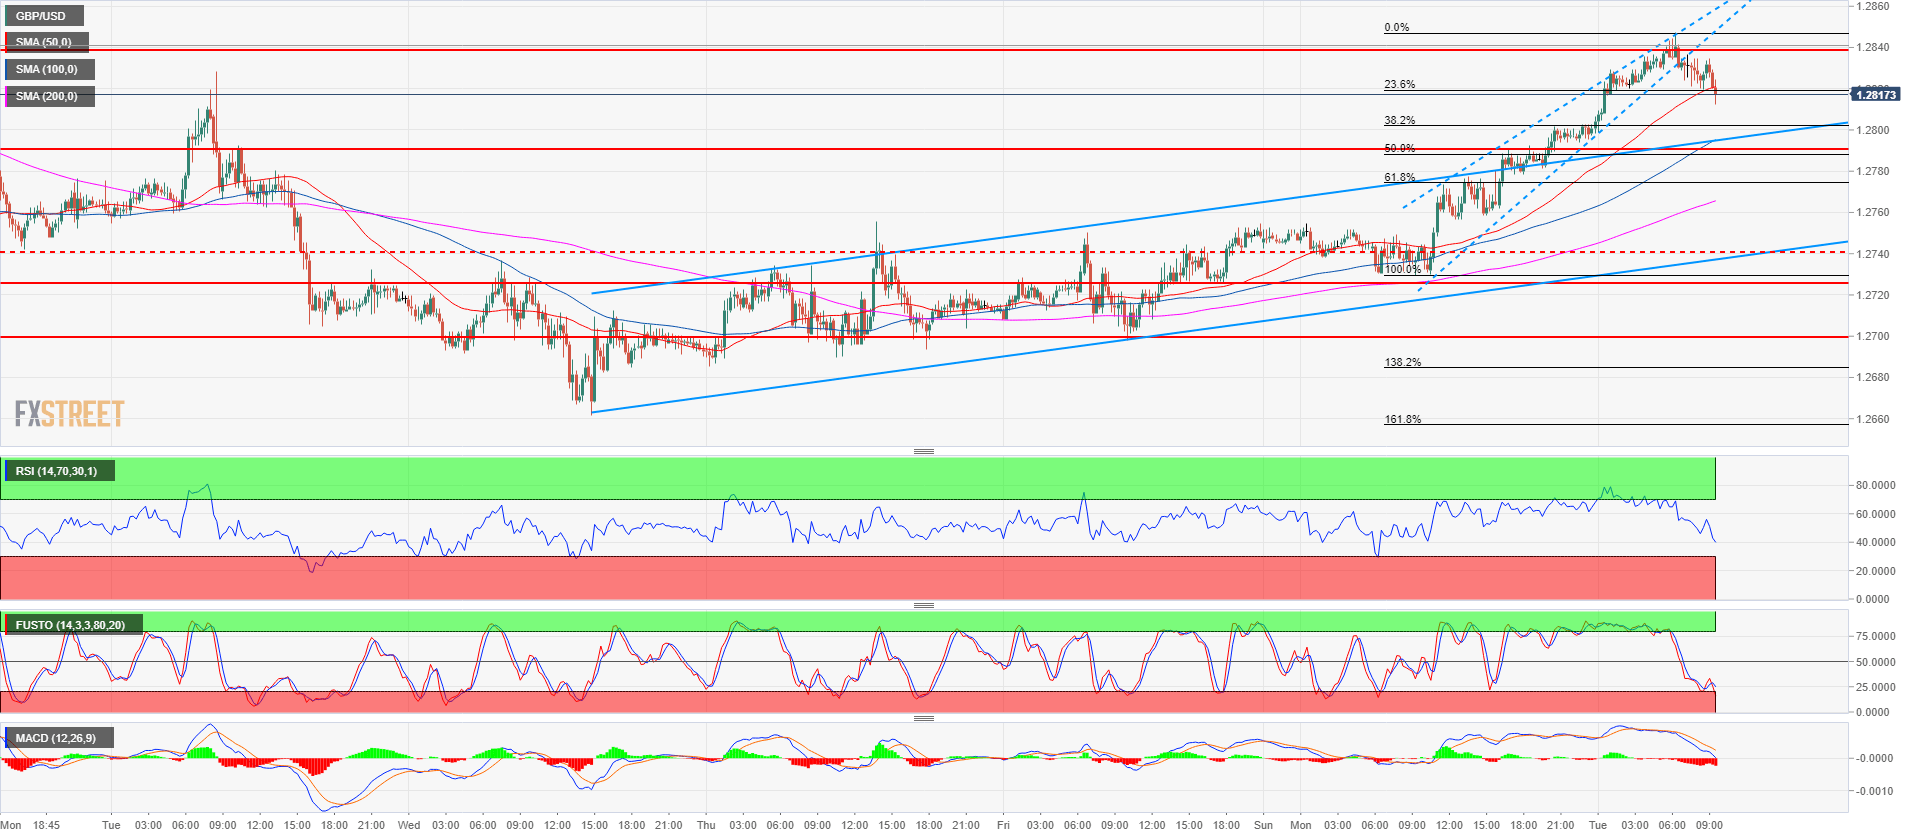
- GBP/USD main bear trend is on hold for the fifth consecutive day as the market is having a bullish pullback.
- GBP/USD had a spike breaking above the bullish channel in a rising wedge shape, suggesting that the market went too far too fast. The correction might extend near 1.2789-1.2800 support coinciding with the 50% Fibonacci retracement of the last bull leg from Monday.
- If the market reaches 1.2789-1.2800 support, traders will be watching the market reaction in order to decide if the short-term bullish momentum is still in place.
Spot rate: 1.2819
Relative change: 0.17%
High: 1.2847
Low: 1.2793
Trend: Bearish
Short-term trend: Bullish
Resistance 1: 1.2838, August 10 high
Resistance 2: 1.2900-1.2923 area, figure and August 7 low
Resistance 3: 1.2957 July 17 low
Support 1: 1.2789-1.2800 area, intraday swing high and figure
Support 2: 1.2723, August 10 low
Support 3: 1.2700 figure
Support 4: 1.2661, current 2018 low
Support 5: 1.2589 June 21, 2017 low
Support 6: 1.2500 figure
Support 7: 1.2365 April 7, 2017 high
