“¢ The precious metal struggled to build on its momentum further beyond 200-hour SMA and stalled its recovery move near 61.8% Fibonacci retracement level of the $1217-$1160 downfall.
“¢ A modest USD rebound seems to be the only factor prompting some selling at higher levels, amid overbought conditions on the hourly chart.
“¢ Weakness below an ascending trend-line support on the 1-hourly chart now seems to indicate that the recent corrective rally might be running out of steam.
“¢ A follow-through weakness below 50% Fibonacci retracement level support would further add credence to the expectations and open room for a deeper pull-back.
Gold 1-hourly chart
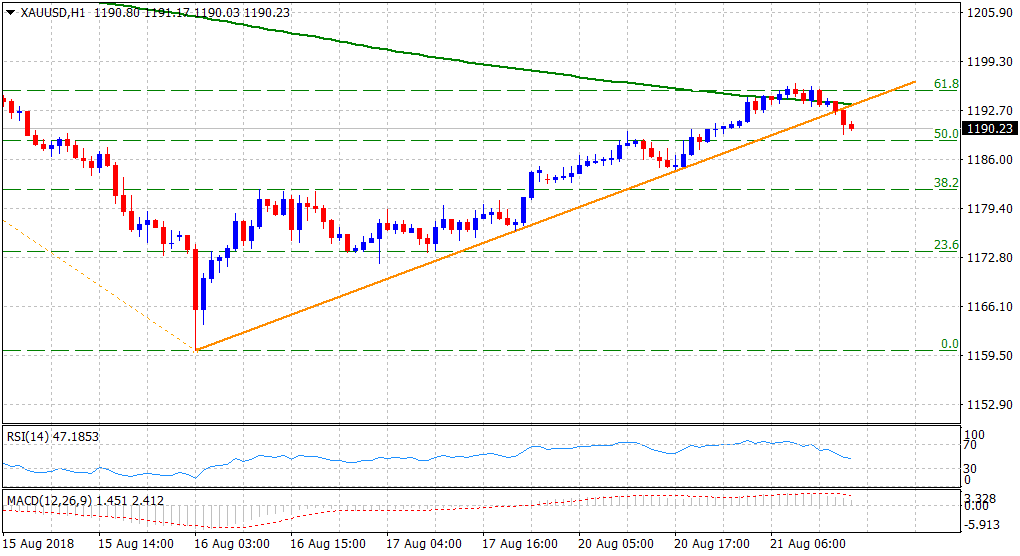
Current Price: $1190.23
Daily High: $1196.40
Trend: Turning bearish again
Resistance
R1: $1,196 (current day swing high)
R2: $1,200 (psychological round figure mark)
R3: $1,206 (horizontal zone)
Support
S1: $1,188 (50% Fibo. level)
S2: $1,179.50 (S2 daily pivot-point)
S3: $1,174 (Aug. 16 daily closing)
