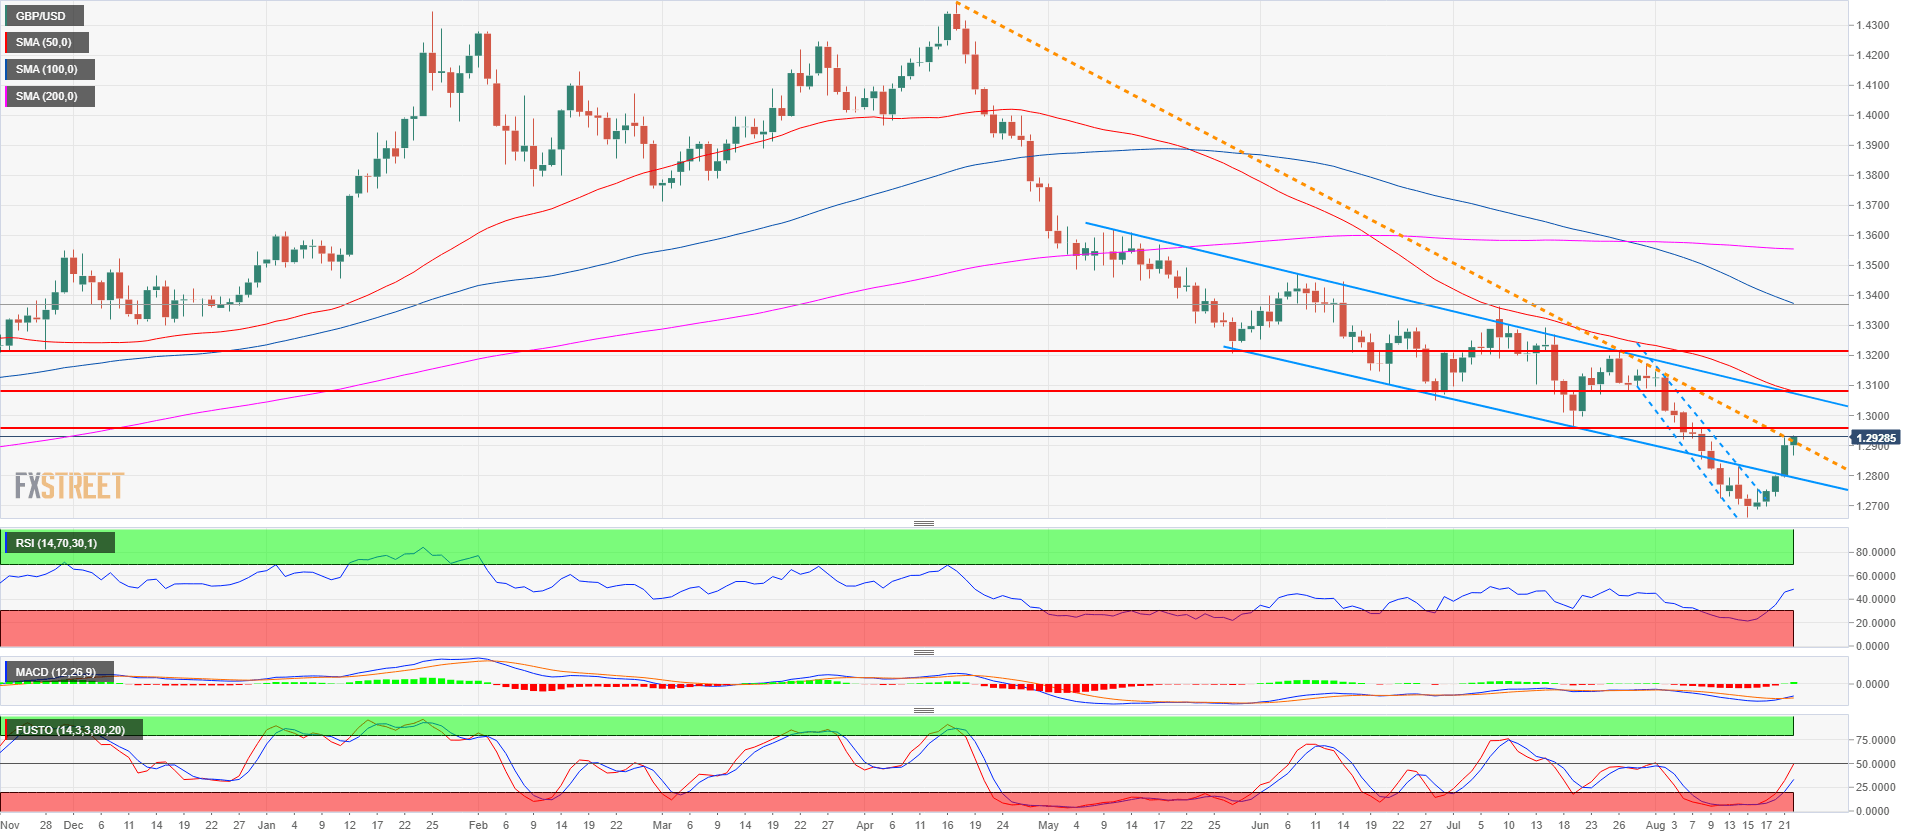
- GBP/USD bear trend is taking a breather as bulls have taken control of the market for the 6th consecutive day.
- GBP/USD bulls are now busy trying to break above the multi-month bear trendline from mid-April. Nothing indicates that the bullish move should abate any time soon. The daily Relative Strength Index (RSI) is rising from oversold condition now at about 48, the Moving Average Convergence Divergence (MACD) is bullish and the Full Stochastics Oscillator is rising without being in overbought territories. All indicates that bulls have what it takes to revisit the upper trendline (blue). The key bull targets are located at 1.2957 swing low and 1.3082 supply/demand level.
- The invalidation point for the bull trend would be located on break below 1.2800 figure.
Spot rate: 1.2931
Relative change: 0.23%
High: 1.2932
Low: 1.2868
Trend: Bearish
Short-term trend: Bullish above 1.2800
Resistance 1: 1.2957 July 19 low
Resistance 2: 1.3082-1.3100 supply/demand level and figure
Resistance 3: 1.3214 July 26 swing high
Support 1: 1.2900-1.2923 area, figure and August 7 low
Support 2: 1.2838, August 10 high
Support 3: 1.2789-1.2800 area, intraday swing high and figure
Support 4: 1.2723, August 10 low
Support 5: 1.2700 figure
