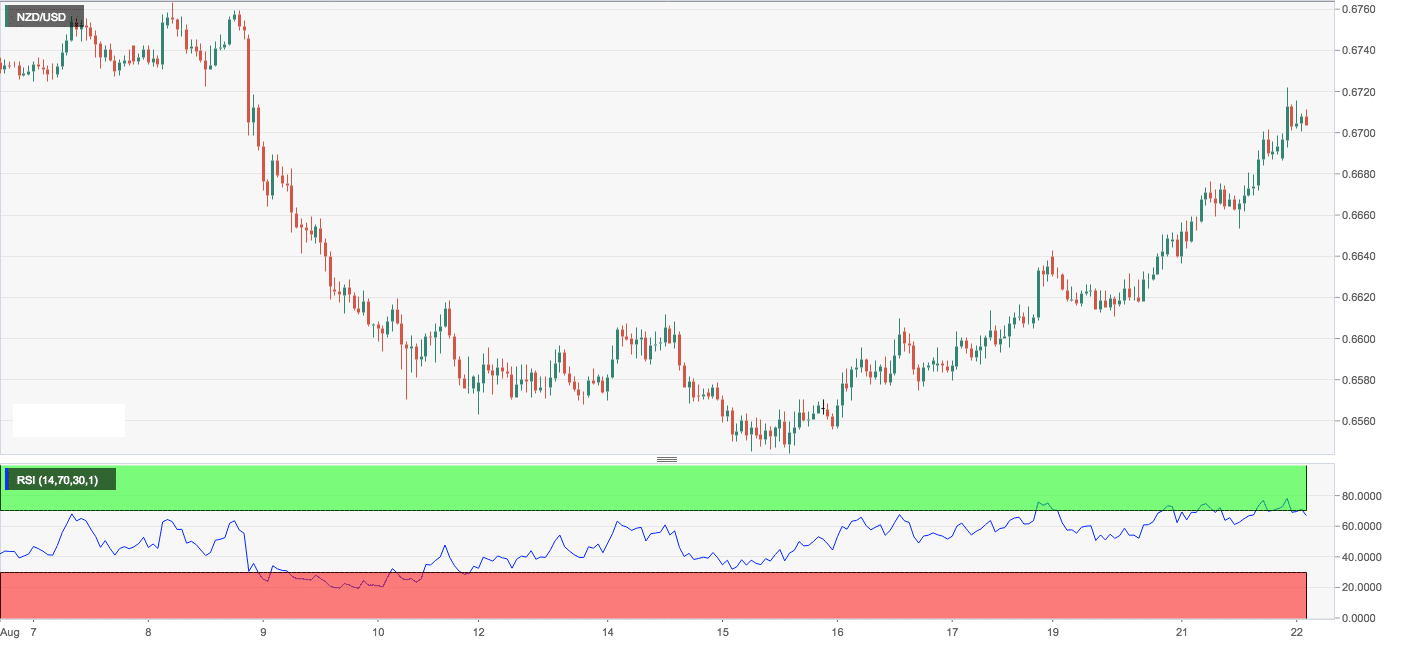
- The NZD/USD pair is flirting with the trendline sloping downwards from the April 13 high and July 26 high but may have a tough time scaling it as the relative strength index (RSI) one the hourly and 4-hour chart is flashing overbought conditions.
- So, a minor pullback could be in the offing and more importantly, that could recharge engines for a convincing break above the long-term trendline resistance.
Hourly chart
Daily chart
-636705031879348230.png)
Spot Rate: 0.6705
Daily High: 0.6720
Daily Low: 0.6687
Trend: Neutral
R1: 0.6720 (Daily high + trendline hurdle)
R2: 0.6769 (50-day MA)
R3: 0.6851 (July 26 high)
Support
S1: 0.6687 (session low)
S2: 0.6651 (5-day MA)
S3: 0.6616 (10-day MA)
