- USD/JPY main bull trend has been on hold since July 19. After finding support at the 100 and 200-day simple moving averages the bulls are now considering resuming the trend.
- USD/JPY broke above the bearish trendline from August 15 as well as 50, 100 and 200-period simple moving average suggesting a bullish bias. Key targets to the upside are 111.00 figure and 111.45 August 8 high.
- A sustained breakout below 110.10 would invalidate the bullish bias.
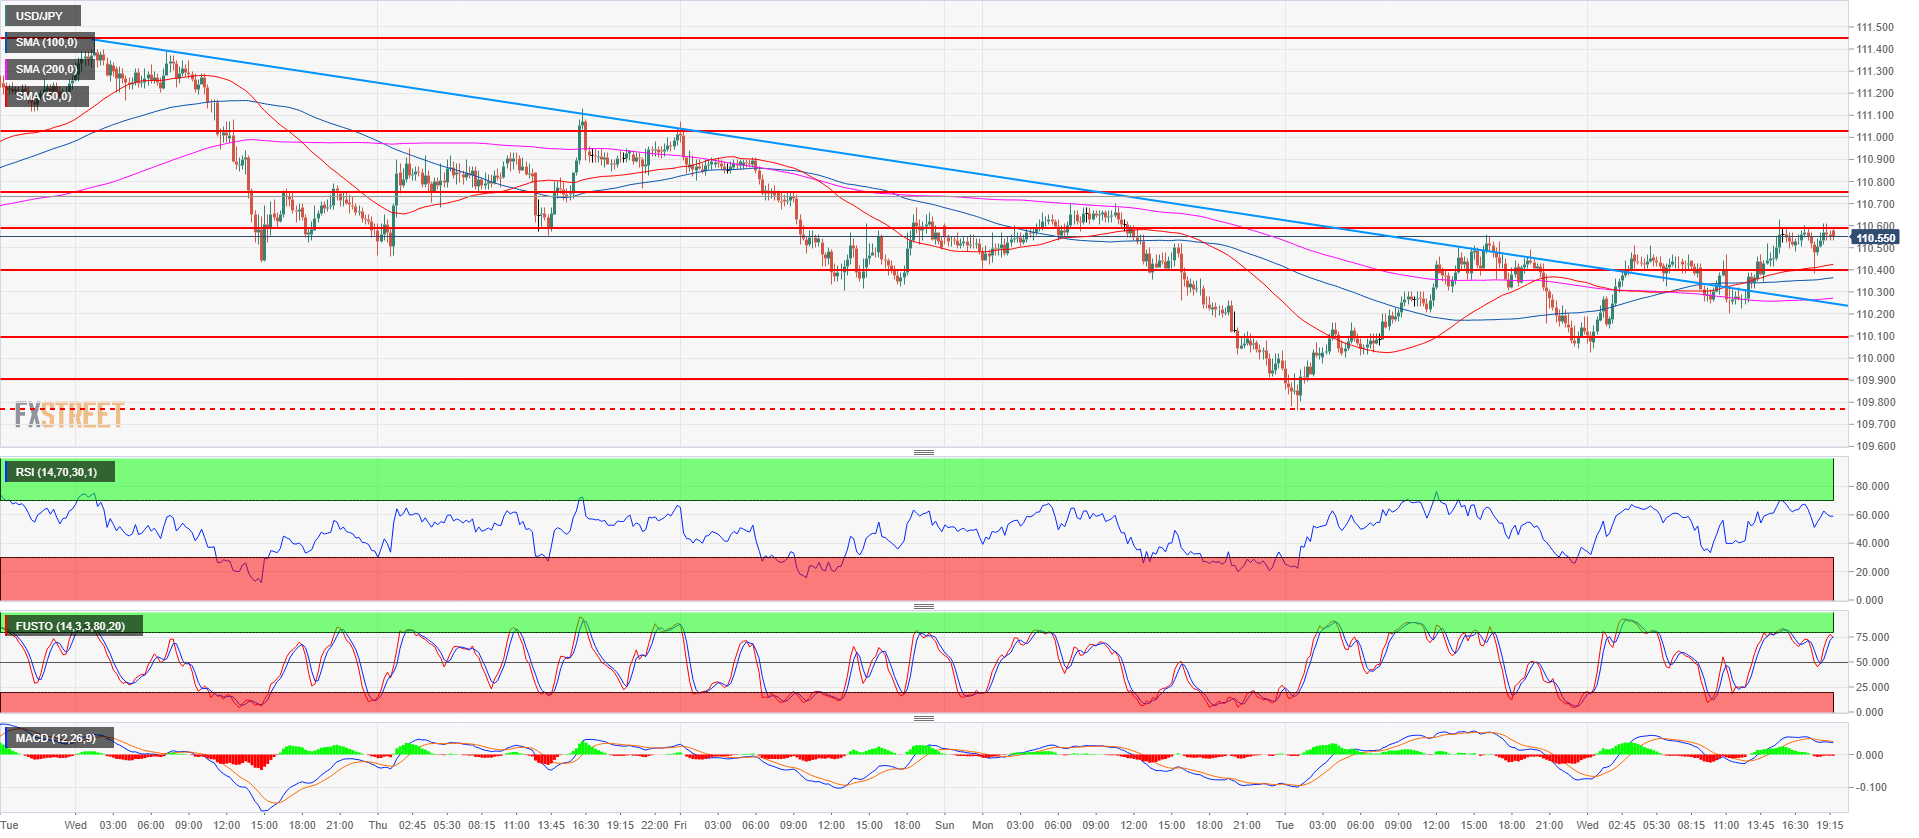
Spot rate: 110.56
Relative change: 0.24%
High: 110.63
Low: 110.02
Main trend: Bullish
Resistance 1: 110.58 July 26 swing low
Resistance 2: 110.75, July 23 low
Resistance 3: 111.00 figure
Resistance 4: 111.45 August 8 high
Support 1: 110.40 supply/demand level
Support 2: 110.10 August 13 swing low
Support 3: 109.91-97 area, 200 and 100-day simple moving average
Support 4: 109.37 June 25 swing low
Support 5: 109.19 June 8 low
