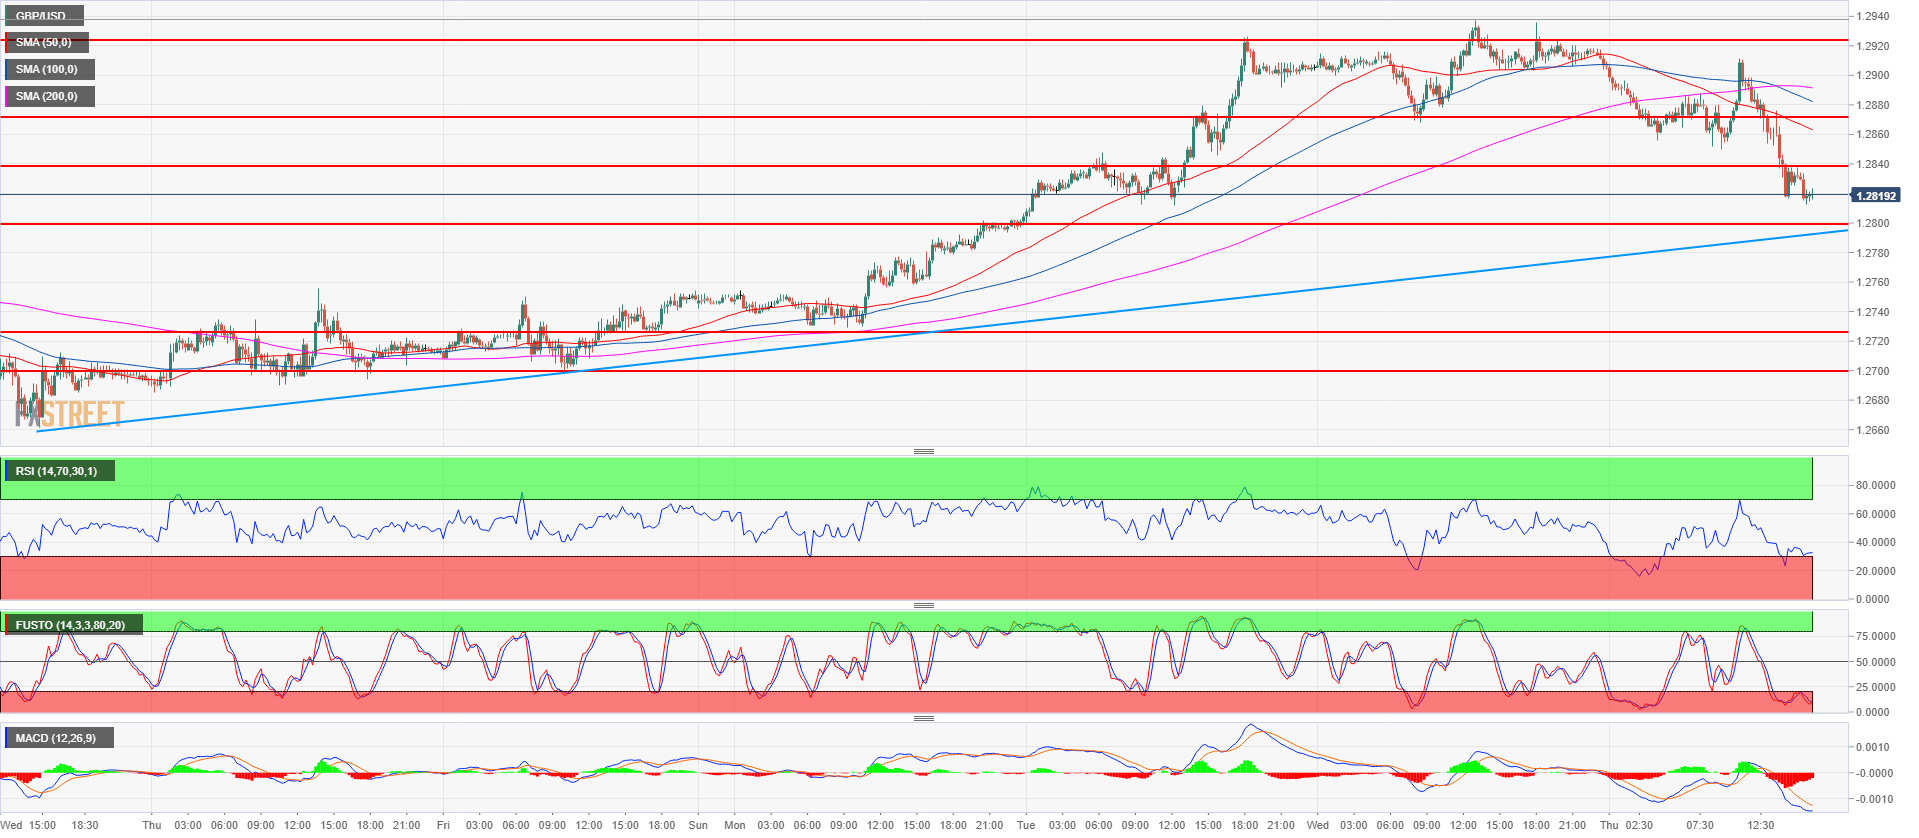
- GBP/USD main bear trend is resuming as the market couldn’t break above the key 1.2957 level.
- GBP/USD is trading below its 50, 100 and 200-period simple moving averages suggesting a bearish bias. The first downside target is just below at 1.2800 and the bullish trendline. A break below the level would open the door to 1.2723, August 10 low.
- A bull breakout above 1.2957 would invalidate the bearish bias.
Spot rate: 1.2809
Relative change: -0.79%
High: 1.2920
Low: 1.2805
Trend: Bearish below 1.2957
Resistance 1: 1.2838, August 10 high
Resistance 2: 1.2868 current August 22 low
Resistance 3: 1.2900-1.2923 area, figure and August 7 low
Resistance 4: 1.2900-1.2923 area, figure and August 7 low
Resistance 5: 1.2957 July 19 swing low
Resistance 6: 1.3082-1.3100 supply/demand level and figure
Resistance 7: 1.3214 July 26 swing high
Support 1: 1.2800 figure
Support 2: 1.2700-1.2723 zone, figure and August 10 low
Support 3: 1.2700 figure
Support 4: 1.2661 current 2018 low
