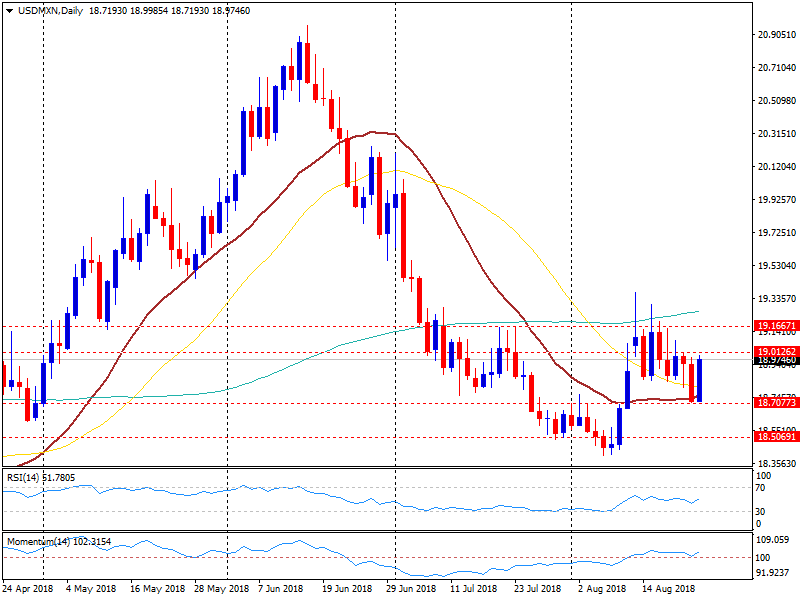
- The pair is rebounding from a key technical support: a horizontal line and the 20-day moving average around 18.70.
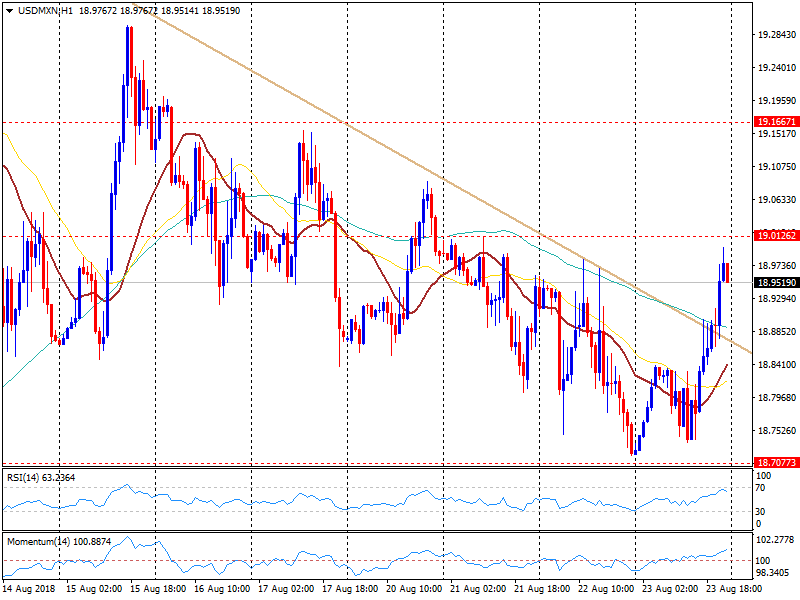
- Price broke above a short-term downtrend and rose to test 19.00, ending the 5-day slide. A consolidation above 19.00 could lead to more gains with a target at 19.15.
- The 18.85 zone is again a support area, followed by 18.70. A daily close under 18.70 (the new bottom) is needed to clear the way to more losses.
USD/MXN hourly chart
USD/MXN Daily chart
Spot: 18.96
Daily high: 18.99
Daily low: 18.71
Support Levels
S1: 18.85
S2: 18.70
S3: 18.50
Resistance Levels
R1: 19.00
R2: 19.15
R3: 19.24
