- GBP/USD main bear trend is currently on hold.
- GBP/USD found support at the August 15 bull trendline and the 50-period simple moving average crossed above the 100 SMA which is showing some bullish activity. However, the market is still trading below the 200 SMA and the bearish trendline (blue). Bulls would need a breakout above those level and the 1.2868 level in order to confirm the short-term bullish bias. Until then, the trend remains to the downside with targets at 1.2800 and 1.2700-1.2723 zone.
GBP/USD 15-minute chart
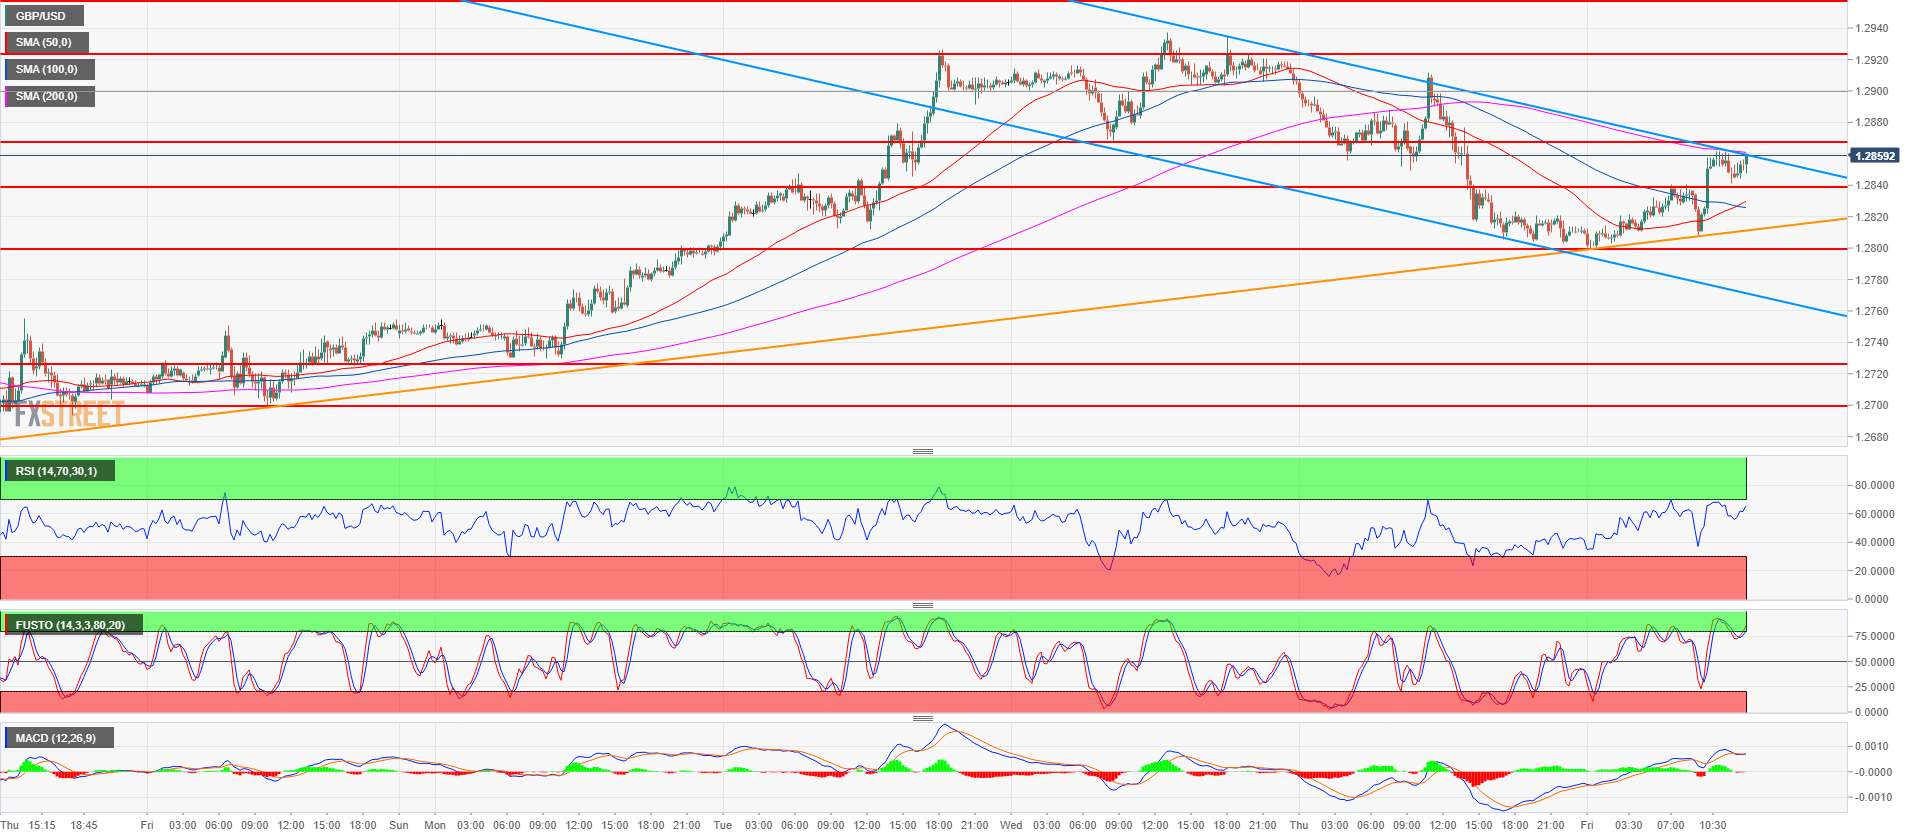
Spot rate: 1.2857
Relative change: 0.36%
High: 1.2861
Low: 1.2799
Trend: Bearish below 1.2870
Resistance 1: 1.2868 August 22 low
Resistance 2: 1.2900-1.2923 area, figure and August 7 low
Resistance 3: 1.2900-1.2923 area, figure and August 7 low
Resistance 4: 1.2957 July 19 swing low
Resistance 5: 1.3082-1.3100 supply/demand level and figure
Resistance 6: 1.3214 July 26 swing high
Support 1: 1.2838, August 10 high
Support 2: 1.2800 figure
Support 3: 1.2700-1.2723 zone, figure and August 10 low
Support 4: 1.2700 figure
Support 5: 1.2661 current 2018 low
